


Recall that my preferred EWP form the November lows is a Double Zig Zag.
This count implies that from the December 31 low price has to unfold a Zig Zag in order to complete the pattern therefore now we are in the wave (A).
Yesterday I was looking for a contracting pattern = Triangle.
This pattern + the upward thrust could have completed the Double Zig Zag from the November low and it would have opened the door for a meaningful correction. Instead bulls had another unexpected strong performance and when price breached last week's peak the Triangle scenario was aborted.
Yesterday I mentioned that: "If instead of forming the Triangle, today, price breaks to the upside (I don't expect this scenario) then price would be still involved in extending higher the wave (A) off the December 31 low".
So price keeps moving higher with overlapping waves, giving misleading interpretations of the EWP as instead of consolidation moves which usually suggest Flats / Triangles bulls achieve short-squeezes pushing price higher.
The fact of the matter is that if the count that I am following is correct price is still involved in the wave (A) of the second Zig Zag (most likely in the final stages), therefore the EWP is not complete yet.
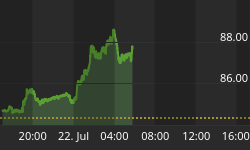
Below in the SPX 60 min chart I show my preferred count.
As you can see the overlapping up leg off the Jan 8 could be suggesting a potential Ending Diagonal. If it is still not done I would be looking at the upper trend line for a reversal pattern, keep in mind that the September 14 high at = 1474.51, today it will probably be a magnet.
At the moment what I can say is that price has to breach the last higher low at 1461.20 in order to increase the odds that the wave (A) is in place. If I see an ending pattern I will post it on Twitter/Stocktwits.

Hence EW wise I expect an immediate short-term top (Today or next Monday), which will be followed by a wave (B) pullback, which will eventually be bought once again. Therefore a meaningful pullback will be delayed until the DZZ is over maybe by the end of January.
In addition to my short-term bearish stance (bias) we have negative divergences on both the daily RSI and the McClellan Oscillator. Negative divergences usually are the "warm-up" phase of a pending correction.
- Negative divergence of the RSI:

- Negative divergence of the McClellan Oscillator:

Enjoy the weekend.


