There is a universal understanding that no major trend can exist without Major Institutions being 'in on' the trade. With the deepest pockets on Wall Street, these BIG BULLIES are also notorious for manipulating the displacement (of shares) at key bottoms in order to better position their entry points! The most traditional and common method is a running of stops at crowded support levels. It creates a forced debacle where prices are in a reeling tail spin, leaving investors totally shell shocked! Then within days, or in some cases intra-day, prices immediately reverse back to their collapsing point.
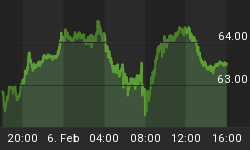
The Miners is a working example- because its chart pattern is a clear cut technical aberration with now an oversupply of shares up for grabs! And this inspired stroke of selling has generated a deeply oversold condition that is, comparable to the "July Bottom"---- of which came several days prior to a multi-month advance.
But this discrepancy and perhaps most encouraging sign of all is ---that prices are residing at higher levels! Let me explain.
Elevated readings of the 'Gold to Miners ratio' have a credible tendency to mark important bottoms. Readings, especially this past week, certainly justify the current climate as not only bottom worthy, but very stretched-- while holding safely above the "July lows".
There is an implication here! And that is, that the most recent three day wipe out is unlikely to go much further because everyone who would've sold out, has already done so! This ground halting reversal will be in keeping of a larger framework of the current Bull market's livelihood, and that is, maintaining an orderly (trend shaping) sequence of higher highs and higher lows.
The Gold to Miner Ratio

The Complete Coverage Report offers two subscriptions -- $9.95/month and $100/year. It is well worth the information received.


