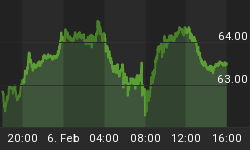
This is just a brief update:
Yesterday SPX achieved a new marginal higher high aborting the bearish setup number two. It looks like investors are chasing stocks believing that FED will always prevent a decline. But something is cooking since this time there was no short squeeze, since probably there is no short left in the market to be squeezed.
Now I know that as long down side action is corrective bulls will buy the dip so no chance of kicking off the overdue correction as long as bears do not achieve an impulsive decline.
I am not a haughty investor but my analysis is not unbiased either, since I work under convictions, which are made of Elliott Wave Patterns, traditional Technical and Sentiment Analysis. So as you might imagine I don't change a comma regarding the long term count (Discussed in my last weekend update) nor I modify my view regarding the up leg from the December lows, which despite the frustration of the last couple of days, in my opinion, price is involved in a complex topping pattern.
My major arguments are:
- Overbought Summation Index
- Negative divergence of the daily RSI
- Negative divergence of the McClellan Oscillator
- Negative divergence of the NYSE 10d Adv-Dec Volume
- VIX is not confirming the new equity highs
- Bullish sentiment has reached extremes.
- Initial cracks of the uptrend are appearing in Europe (Not only IBEX and MIBTEL but also the EUROXX 50 and the DAX)
- The EUR may have already started the pullback
So I remain bearish biased expecting a corrective pattern that will retrace a "segment" of the December's up leg.
I am not going to review all the bearish arguments but I want to show you the huge negative divergence of the SPX daily RSI. The picture is worth more than "1000 words":
Lets move on to the short-term price action, which is a nightmare for an EW investor like myself.
a) Either we have a double top, which I really doubt since it will ONLY be confirmed if today bears achieve an impulsive decline:
b) Or given, the corrective moves both up and down; price could be forming a complex Ending Diagonal. Probably we are now in the wave (A) of (III), in which case this agonizingly waiting game could be prolonged into next week:
At least we now we know where the sell stops are located = 1495 so this is the magical number that bears have to reclaim.
I can be a bull or a bear but NOW I am firmly convinced that the upside potential left in this mature up leg is insignificant compared to the risk of a 4%-6% correction, If this is the scenario once the correction is approaching its exhaustion I will be gladly switch to bull mode.
Below I show the daily chart with the assumption that price is topping out with a bearish rising wedge and the potential target of the wave (IV) if the scenario of an Ending Diagonal is the correct one.
If the SPX Double Top fails then next week I will allot 50% of my interest in seeking a bearish setup in a European Index (Probably the EUROXX 50)
Regarding the TWT Swing Virtual Trading I remain long SPXU. I did not execute the stop loss since the eop print was below last Friday's hod. I will probably act as an undisciplined trader by keeping the position (I will decide by today's eod what to do.)
I will be out from Thursday afternoon until Sunday as I take the opportunity of a school holiday of my children for a ski break. So this is my last post until probably next Monday.


