


Perception of Euro Stability
One can argue that the fear of a systemic meltdown capped markets between early 2010 and late 2012. The primary driver behind meltdown fears was the European debt crisis. For various reasons, mostly related to the European Central Bank, markets are no longer on edge about the imminent collapse of the euro. European stocks posted solid gains Thursday; according to the Wall Street Journal:
European markets were broadly higher. The Stoxx Europe 600 index rose 1.1% to its highest level since June 2008, as a Spanish government-bond auction and dovish comments from a European Central Bank official helped offset weak employment data. Spain's IBEX 35 index gained 1.9%.
Risk-On Tone In United States
The financial markets looked very tentative between January 24 and March 1. As outlined at the 3:13 mark of this week's video, markets shifted back to a "risk-on" posture during the week ending Friday, March 8:
Energy Leads The Way
All 10 S&P industry groups posted gains Thursday, which is a bullish sign of broad participation. From the Wall Street Journal:
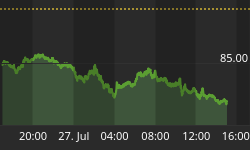
Energy shares led gains across all 10 of the S&P 500's sectors as a government report showed thinning natural-gas inventories, sending gas futures prices to a nearly four-month high.
Over longer periods of time stocks and crude oil tend to "zig and zag" together, which means they are positively correlated. All things being equal, when demand for energy increases, it reflects a growing economy; stocks like growing economies.
Three ETFs To Watch Friday
The crude oil ETF (USO) appears to be trying to make a bullish turn. In the chart below, USO recently cleared a bearish trendline near point B. If USO's consolidation can be followed by a breakout above resistance near point A, it would improve the bullish odds for stocks. MACD is a commonly used indicator to monitor momentum. After a "bullish MACD cross" near point C, both USO and the S&P 500 marched higher (see point D for S&P 500). A similar bullish MACD cross occurred this week.

Materials - The Bulls' Achilles' Heel
Like crude oil, demand for materials stocks tends to correlate with confidence in future economic outcomes. Materials had trouble getting over the hump as stocks were pushing higher last September. Eventually, both the S&P 500 and the materials ETF (XLB) peaked on September 14 and corrective action followed. This week XLB is again trying to get over the resistance hump. A close Friday above 39.76 would be bullish for all risk assets.

A Leader Ready To Lead Again?
Like crude oil and materials stocks, mid-caps (MDY) have set-ups in place that more often than not lead to bullish outcomes. In the chart below, notice how MDY pulled back near point A. The corrective action was followed by a bullish break above the pink line. The breakout was accompanied by a bullish MACD cross near point C. After A & C, MDY pushed higher. A similar set-up is in place now (see point B). Point D shows the S&P 500 tends to do well when small-caps and mid-caps are doing well.

Friday Important
The weekly charts we follow still look bullish as of Thursday's close. In recent months, it has not been unusual for the weekly charts to change character on Friday, meaning how they close out the week is much more important than their look on Thursday.
Economic Reports = Need For Open Mind
Friday brings two important reports in the form of the Consumer Price Index and industrial production. The market's reaction to new data could well set the tone Friday. Good reports and healthy weekly charts near the close Friday would allow us to consider adding to our long positions.


