• 657 days Will The ECB Continue To Hike Rates?
  • 657 days Forbes: Aramco Remains Largest Company In The Middle East
  • 659 days Caltech Scientists Succesfully Beam Back Solar Power From Space
  • 1,059 days Could Crypto Overtake Traditional Investment?
  • 1,063 days Americans Still Quitting Jobs At Record Pace
  • 1,065 days FinTech Startups Tapping VC Money for ‘Immigrant Banking’
  • 1,068 days Is The Dollar Too Strong?
  • 1,069 days Big Tech Disappoints Investors on Earnings Calls
  • 1,070 days Fear And Celebration On Twitter as Musk Takes The Reins
  • 1,071 days China Is Quietly Trying To Distance Itself From Russia
  • 1,072 days Tech and Internet Giants’ Earnings In Focus After Netflix’s Stinker
  • 1,076 days Crypto Investors Won Big In 2021
  • 1,076 days The ‘Metaverse’ Economy Could be Worth $13 Trillion By 2030
  • 1,077 days Food Prices Are Skyrocketing As Putin’s War Persists
  • 1,079 days Pentagon Resignations Illustrate Our ‘Commercial’ Defense Dilemma
  • 1,079 days US Banks Shrug off Nearly $15 Billion In Russian Write-Offs
  • 1,083 days Cannabis Stocks in Holding Pattern Despite Positive Momentum
  • 1,083 days Is Musk A Bastion Of Free Speech Or Will His Absolutist Stance Backfire?
  • 1,084 days Two ETFs That Could Hedge Against Extreme Market Volatility
  • 1,086 days Are NFTs About To Take Over Gaming?
  1. Home
  2. Markets
  3. Other

Daily: Waiting For a New High

The market resumed its advance on Wednesday. So, we feel rather confident with current wave count.

If this scenario is the right one, we should reach higher levels in coming days.

Thereafter, a meaningful pullback/correction should occur.

Sigma Whole Market Index Chart

Our indicators remain in favor of further advance: the Swing moved to '4', telling us the trend remains bias to the upside.

Sigma Table

There is no change in our short term model, it remains in 'buy' mode for both the NDX and the SPX:

NDX Buy/Sell table

SPX Buy/Sell Table


Conclusion:

The chart analysis is fully in line with our indicators, there is no sign of reversal at this stage.

For those of you interested in our intraday move, you can visit our site during the day: we post all our trades in real time. You can also subscribe to our twitter account (@SigmaTradingOsc), it is free and you are updated on our latest view/trades.

Short term positions:
- no more position

Medium term positions:
- short 3 SPX at 1446.09
- Short 1 NDX at 2758.8
- short 2 CAC at 3251.07

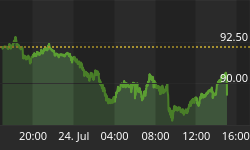
We add 2years charts of the results generated by our short term model (data are in points) on both the SPX and the NDX.

SPX P/L Chart

NDX P/L Chart


Back to homepage

Leave a comment

Leave a comment