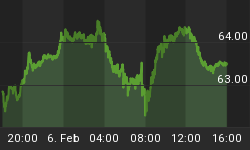
Our title seems obvious. We all know that the US$ tends to be negatively correlated with commodity prices. This is true in the short-term but not always so over the long-term. The US$ index is currently nearing 83. It's at the same level it was in 2007 when Gold was trading in the $600s and the CCI (currently 554) was trading near 400. The US$ index is near the same level it was at the end of 2005 when Gold was trading below $400 and the CCI was trading below 300. This tells us that the bull market in precious and hard assets goes way beyond simple US$ weakness. It is driven by long-term supply and demand dynamics as well as rampant monetary inflation from global parties and not just the USA. Throughout this bull market, key advances and turning points have originated from strength against foreign currencies and then sustained strength amid textbook US$ weakness.
First let's take a look at Gold priced in US$ and then Gold priced against the inverse of the US$ (a foreign currency basket represented by the ETF UDN). Note that Gold/UDN is often a leading indicator for Gold in US$. Gold/UND bottomed in the summer of 2008 and made a higher low in October, when Gold bottomed. Gold/UDN broke to new highs in early 2009 while Gold didn't break to new highs until September 2009. The same happened in early 2010 as Gold/UDN brokeout first. At present, there are no major divergences but Gold/UDN has been quite a bit stronger than Gold in recent weeks.

Meanwhile, we have similar observations when looking at commodities via the CCI and UDN. During 2010 CCI/UDN broke to new highs in the spring while CCI didn't breakout until September. CCI/UDN peaked ahead of the CCI by a few months in early 2011. Currently, CCI/UDN is showing a positive divergence. A close above 22 would be quite telling as commodities would be at 18-month highs when priced against foreign currencies.

In terms of sentiment, we already know the depths of Gold and the heights of the equity market. The chart below (source) shows the CCI with the positioning of fund managers as surveyed by the monthly Bank of America Merrill Lynch fund manager survey. The current weighting of commodities (in the average fund manager portfolio) is the second lowest in four years!

Meanwhile, as you'd expect given the skepticism on commodities, sentiment for Uncle Buck has grown more bullish. As per sentimentrader.com, public opinion is currently at 75% bulls. Peaks in the US$ have occurred with public opinion at 80% bulls. The US$ has a bit more upside until resistance at 87-88.

Moving back to our original point, the US$ plays an important role in commodity markets but is not the sole determinant of exact peaks and bottoms. In fact, the US$ is usually a lagging indicator for Gold and gold stocks as shown below. We plot the US$ inverse, Gold and the HUI. The blue line shows the important bottoms in Gold and the HUI and the red line shows the corresponding bottoms in the US$ inverse. Essentially, the precious metals market will form major bottoms ahead of tops in the US$.

What does all this mean going forward? We believe that 2013 will mark an important transition year as the equity market is likely to make a cyclical peak while commodities make an important cyclical bottom. We already know that sentiment on commodities and precious metals is at dumpster diver type levels. Adjust for the US$ strength and it's clear that these markets are showing some short-term strength amid poor sentiment. That is a positive sign and one we often see ahead of key turning points in these markets. However, the US$ has some more upside before its next important peak. Precious metals have found a bottom and are moving higher, but they won't embark on their next big move until the US$ peaks. We've carefully added to longs in recent weeks but will remain patient in our anticipation of the next big leg higher later this year.
Good Luck!
If you'd be interested in professional guidance in uncovering the producers and explorers poised for big gains in the next few years then we invite you to learn more about our service.


