• 693 days Will The ECB Continue To Hike Rates?
  • 693 days Forbes: Aramco Remains Largest Company In The Middle East
  • 695 days Caltech Scientists Succesfully Beam Back Solar Power From Space
  • 1,095 days Could Crypto Overtake Traditional Investment?
  • 1,100 days Americans Still Quitting Jobs At Record Pace
  • 1,102 days FinTech Startups Tapping VC Money for ‘Immigrant Banking’
  • 1,105 days Is The Dollar Too Strong?
  • 1,105 days Big Tech Disappoints Investors on Earnings Calls
  • 1,106 days Fear And Celebration On Twitter as Musk Takes The Reins
  • 1,108 days China Is Quietly Trying To Distance Itself From Russia
  • 1,108 days Tech and Internet Giants’ Earnings In Focus After Netflix’s Stinker
  • 1,112 days Crypto Investors Won Big In 2021
  • 1,112 days The ‘Metaverse’ Economy Could be Worth $13 Trillion By 2030
  • 1,113 days Food Prices Are Skyrocketing As Putin’s War Persists
  • 1,115 days Pentagon Resignations Illustrate Our ‘Commercial’ Defense Dilemma
  • 1,116 days US Banks Shrug off Nearly $15 Billion In Russian Write-Offs
  • 1,119 days Cannabis Stocks in Holding Pattern Despite Positive Momentum
  • 1,120 days Is Musk A Bastion Of Free Speech Or Will His Absolutist Stance Backfire?
  • 1,120 days Two ETFs That Could Hedge Against Extreme Market Volatility
  • 1,122 days Are NFTs About To Take Over Gaming?
  1. Home
  2. Markets
  3. Other

The State of the Trend

Let's pick-up right where we left off two weeks ago, and focus on intraday price action. SPY continues to trade within the Cyprus box, despite a short-lived breakout attempt on April 2nd. That box continues to define the bullish and bearish trigger levels going forward:

SPY continues to trade within the Cyprus box

While the intraday trend is flat, the daily, weekly and monthly SPX and DJIA trends remain up.

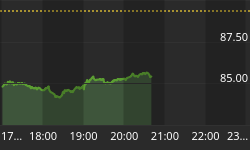
Despite breaking below the box at the open on Friday, the Qs managed to claw their way back in:

Despite breaking below the box at the open on Friday, the Qs managed to claw their way back in

Their future direction is closely linked to APPL which, at the moment, sits right on support:

Apple Chart

The intraday flat action in the major indices takes place in the context of a regular, cyclical downturn in market internals. At the current rate they should bottom in a day or two:

CIT Dates Chart

Try to keep that in mind if you find yourself getting overly bearish.


Back to homepage

Leave a comment

Leave a comment