


The good news is:
• Although the market had a rough week, new lows remained benign.
The negatives
New highs deteriorated badly last week and the secondaries underperformed the blue chips.
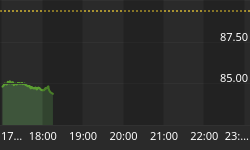
The chart below covers the past 6 months showing the NASDAQ composite in blue and a 10% trend (19 day EMA) of NASDAQ new highs OTC NH in green. Dashed vertical lines have been drawn on the 1st trading day of each month.
OTC NH fell sharply last week.

The kind of deterioration shown in the 1st chart can go on for months before the market collapses as you can see in the chart below from 2011.

The next chart is similar to the 1st one except it shows the S&P 500 (SPX) in red and NY NH, in green, has been calculated from NYSE data.
NY NH has been a little weaker than OTC NH and it also fell sharply last week.

The next chart covers the past month showing some of the major indices on log scales to illustrate their relative performance. Dashed vertical lines have been drawn on the 1st trading day of each week.
The secondaries are leading the way down, the SPX has been the strongest of the indices while the Russell 2000 (R2K) has been the weakest.

The positives
New lows remained insignificant last week.
The chart below covers the past 6 months showing the OTC in blue and a 40% trend (4 day EMA) of NASDAQ new highs / (new highs + new lows) (OTC HL Ratio) in red. Dashed horizontal lines have been drawn at 10% levels for the indicator; the line is solid at the neutral 50% level.
OTC HL Ratio fell sharply, but remains above the neutral 50% level.

The chart below is similar to the one above except it shows SPX in red and NY HL Ratio, in blue, has been calculated from NYSE data.
NY HL Ratio also fell sharply last week, but, remains relatively high.

Seasonality
Next week includes the 5 trading days prior to the 2nd Friday of April during the 1st year of the Presidential Cycle.
The tables below show the daily return on a percentage basis for the 5 trading days prior to the 2nd Friday of April during the 1st year of the Presidential Cycle.
OTC data covers the period from 1963 - 2012 and SPX data covers the period from 1953 - 2012. There are summaries for both the 1st year of the Presidential Cycle and all years combined. Prior to 1953 the market traded 6 days a week so that data has been ignored.
Average returns have been mixed, very strong during the 1st year of the Presidential Cycle and modest the other years.
Report for the week before the 2nd Friday of April.
The number following the year is the position in the Presidential Cycle.
Daily returns from Monday to 2nd Friday.
| OTC Presidential Year 1 | ||||||
| Year | Mon | Tue | Wed | Thur | Fri | Totals |
| 1965-1 | 0.37% | 0.18% | 0.16% | 0.55% | 0.57% | 1.84% |
| 1969-1 | 0.29% | -0.21% | -0.53% | -0.70% | 0.15% | -1.00% |
| 1973-1 | 0.65% | 0.70% | 0.42% | 0.26% | -0.32% | 1.71% |
| 1977-1 | 0.36% | 0.73% | 0.04% | 0.95% | 0.27% | 2.35% |
| 1981-1 | -0.65% | 0.23% | 0.49% | 0.52% | 0.58% | 1.18% |
| 1985-1 | 0.16% | 0.43% | 0.37% | -0.08% | -0.11% | 0.78% |
| 1989-1 | 0.10% | 0.58% | 0.52% | -0.44% | 0.92% | 1.69% |
| Avg | 0.13% | 0.54% | 0.37% | 0.24% | 0.27% | 1.54% |
| 1993-1 | 1.02% | 0.11% | 0.02% | -0.54% | -0.53% | 0.08% |
| 1997-1 | 1.19% | 0.48% | -0.64% | -1.09% | -2.34% | -2.40% |
| 2001-1 | -2.64% | 0.71% | 8.12% | 4.94% | -0.86% | 10.28% |
| 2005-1 | 0.32% | 0.41% | -0.01% | 0.98% | -0.96% | 0.74% |
| 2009-1 | 0.05% | -1.67% | 0.07% | 2.68% | 0.16% | 1.28% |
| Avg | -0.01% | 0.01% | 1.51% | 1.40% | -0.91% | 2.00% |
| OTC summary for Presidential Year 1 1965 - 2009 | ||||||
| Avg | 0.10% | 0.23% | 0.75% | 0.67% | -0.21% | 1.54% |
| Win% | 83% | 83% | 75% | 58% | 50% | 83% |
| OTC summary for all years 1963 - 2012 | ||||||
| Avg | 0.00% | -0.05% | -0.09% | 0.20% | -0.26% | -0.20% |
| Win% | 60% | 54% | 54% | 56% | 54% | 60% |
| SPX Presidential Year 1 | ||||||
| Year | Mon | Tue | Wed | Thur | Fri | Totals |
| 1953-1 | -0.20% | 0.36% | 0.40% | -0.20% | -1.16% | -0.80% |
| 1957-1 | -0.22% | 0.90% | 0.42% | -0.09% | 0.22% | 1.23% |
| 1961-1 | 0.86% | 0.14% | -0.47% | -0.08% | 0.17% | 0.62% |
| 1965-1 | 0.00% | -0.03% | 0.06% | 0.57% | 0.60% | 1.19% |
| 1969-1 | -0.08% | -0.04% | -0.89% | 0.15% | 0.46% | -0.40% |
| Avg | 0.09% | 0.27% | -0.09% | 0.07% | 0.06% | 0.37% |
| 1973-1 | 1.45% | 1.22% | 0.42% | -0.09% | -0.44% | 2.55% |
| 1977-1 | 0.64% | 1.28% | 0.01% | 0.84% | 0.04% | 2.81% |
| 1981-1 | -1.15% | -0.01% | 0.75% | -0.18% | -0.12% | -0.72% |
| 1985-1 | 0.21% | 0.15% | 0.26% | -0.46% | 0.15% | 0.32% |
| 1989-1 | -0.02% | 0.46% | 0.17% | -0.87% | 1.67% | 1.42% |
| Avg | 0.23% | 0.62% | 0.32% | -0.15% | 0.26% | 1.28% |
| 1993-1 | 1.48% | 0.19% | -0.12% | -0.06% | 0.12% | 1.61% |
| 1997-1 | 0.56% | 0.52% | -0.72% | -0.30% | -2.73% | -2.66% |
| 2001-1 | -0.32% | 1.03% | 3.89% | 1.26% | -0.86% | 4.99% |
| 2005-1 | 0.27% | 0.45% | 0.23% | 0.60% | -0.83% | 0.71% |
| 2009-1 | 0.25% | -2.01% | 1.25% | 1.55% | 0.50% | 1.55% |
| Avg | 0.45% | 0.04% | 0.91% | 0.61% | -0.76% | 1.24% |
| SPX summary for Presidential Year 1 1953 - 2009 | ||||||
| Avg | 0.27% | 0.31% | 0.38% | 0.18% | -0.15% | 0.96% |
| Win% | 57% | 73% | 73% | 40% | 60% | 73% |
| SPX summary for all years 1953 - 2012 | ||||||
| Avg | 0.16% | 0.09% | 0.04% | 0.00% | -0.08% | 0.20% |
| Win% | 61% | 55% | 55% | 53% | 53% | 57% |
Money supply (M2)
The money supply chart was provided by Gordon Harms. Money supply growth has deteriorated sharply.
Tom McClellan wrote an interesting piece about Bond closed end funds (CEF's) traded on the NYSE in this week's Chart In Focus, a free weekly newsletter. It explains what we are seeing in the chart below from a different perspective. You can read the report and sign up for Chart in Focus at: http://www.mcoscillator.com/learning_center/weekly_chart/bond_cefs_now_saying_liquidity_is_in_trouble/

Conclusion
The market took a hit last week, but seasonality for the coming week has been very strong so there is a good chance for a bounce.
I expect the major averages to be higher on Friday April 12 than they were on Friday April 5.
Last weeks positive forecast was a miss.
Gordon Harms produces a power point for our local timing group meetings. You can get a copy of that at: http://stockmarket-ta.com/
This report is free to anyone who wants it, so please tell your friends. They can sign up at: http://alphaim.net/signup.html. If it is not for you, reply with REMOVE in the subject line.
Good Luck,
YTD W 6/L 4/T 4


