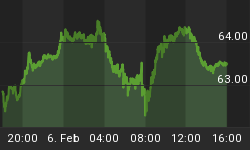
THE MCCLELLAN OSCILLATOR IS OVERBOUGHT
The 4 days rally with a gain of 3.62% has brought in an overbought McClellan Oscillator therefore going forward (Next 1-2 days) the risk of a meaningful pullback is rising. (Meaningful pullback ===> Fibonacci retracement of the up leg off last Friday's lod)

A bearish cross of the Stochastic will trigger the sell signal. If as I expect it is just a 2/3 days pullback the Stochastic should remain above the middle line while the Oscillator should not lose for more than 1 day the zero line.
Yesterday's SPX's entire body of the candlestick above the upper BB is another reason that suggests that this up leg is getting stretched.
But the choppy price action may allow another push higher maybe with the goal of achieving an eow print above the psychological level of 1600. This can be a probable outcome as long as yesterday's lod holds = 1586.17.
Reminder of my preferred count off the November lows:
-
It is unfolding a corrective EWP (Probably a DZZ)
-
Price is now involved in the final wave (C)
-
This means that when it is over price will only retrace a Fibonacci # of the "November" rally.
Since the assumed wave (C) (It began at last Friday's lod) looks corrective I expect that price should unfold a wedge.
Therefore:
-
The expected pullback (Not confirmed yet) may be large (30 +/- handle) but short lived (2-3 days).
-
The target range = 1573 -1562 (20dma).
An impulsive decline + the loss of the 20 dma + NYMO losing the zero line will suggest that price has completed the up leg from the November lows and a large multi week pullback has been kicked off.
Yesterday I explained why in my opinion the following pullback would be bought without endangering the trend from the November lows ===> Usually we should see a negative divergence in the daily RSI.
As a matter of fact so far there is nothing bearish in the momentum indicators. The Stochastic is entering the overbought zone but the MACD has triggered a bullish cross.
Today I will monitor VXX, since sometimes volatility anticipates a reversal of SPX.
I don't know if a bottom is already in place but what is important is that the next rebound should remain below the 20 dma if my SPX short-term scenario is correct.
Have a great weekend.


