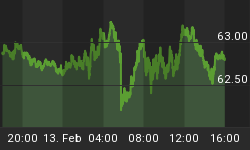
The market printed a lower low on Wednesday, but remains above early April low. If the market is able to go through the pink support, we believe it could quickly drop until the blue horizontal support.

If we take a longer time horizon, we can notice that the Sigma Whole Market Index is now on its 50 days MA (red line on the chart below). In the past, this MA acted as a powerful support to the market.

Looking at our indicators, the Swing moved again to '1', and the Sigma Trend Index moved back in negative territory:

Our short term model remains in sell mode for both the SPX and the NDX:


Our medium term momentum index remains in sell mode (blue line below the red line):

Conclusion:
Both our short term and our medium term models are in sell mode. Nevertheless, the market is now on strong supports, and it won't be easy to move below those levels.
For those of you interested in our intraday move, you can visit our site during the day: we post all our trades in real time. You can also subscribe to our twitter account (@SigmaTradingOsc), it is free and you are updated on our latest view/trades.
Short term positions:
- short 1/2 SPX at 1560.15
- Short 1/2 NDX at 2805.45
- short 1/2 CAC40 at 3754.88
Medium term positions:
- short 3 SPX at 1446.09
- Short 1 NDX at 2758.8
- short 2 CAC at 3251.07


