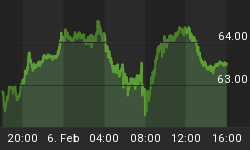
Based on our market breadth analysis we concluded last week that the major indices are due for a rebound. For easy comparison and follow up we'll start with the same two charts to show what transpired.
The SPX intraday chart shows that the index finds itself in a position reminiscent of April 11th:

The market breadth chart shows that the rebound from last week's oversold levels brought it back within the overbought zone:

As one would expect, the Qs benefited from the improved market breadth and rejoined the uptrend:

The weekly SPX chart asks the same question from earlier this month: whether the index will continue within the same channel, or whether it will embark on a steeper ascent:

Based on the evidence presented above, we expect that after a likely end-of month ramp-up, a sideways/down phase will follow.


