


With a show of hands, who out there hasn't heard this saying on at least umpteen different occasions in their lifetime? Just as I thought, I don't see too many hands. Well, one thing that's becoming abundantly clear to me, as I've just begun reading House of Bush, House of Saud, the business of Big Oil has all the trappings [or entrapments, perhaps?] of a very slippery business indeed. While it is my intention to 'drill down' into the subject matter in the aforementioned book in a future paper, a cursory examination of the material shows how deep the fortunes of the Bush family have been interwoven with Big Oil. With the likes of George W. Bush [President of U.S.A. and former Harken Energy Board Member], Dick Cheney [V.P. of U.S.A. and former head of Halliburton] and Condoleezza Rice [Current Sec. of State, former Nat. Sec. Advisor of U.S.A. and former director of Chevron] - the current administration is, shall we say, well versed [pun, perhaps?] in the importance and relevance of the world price of crude oil on America and by extension, the Global Economy.
In case any of you are wondering where I'm going with all of this, it is not my intention, today, to point out or draw attention to alleged conflicted dealings by any of these players. Instead, I'm trying to lay some credible groundwork to explain how well versed these individuals are when it comes to understanding the potential effects or ramifications of a precipitous rise in the world price of oil. In essence, I'm only trying to say that these highly placed, influential persons are nothing short of 'experts' when it comes to the subject matter and business of Big Oil.
What I really wanted to discuss is how the Government's Bureau of Economic Analysis [BEA] measures or arrives at the Unit price of oil [price per barrel] that the U.S. of A. imports each and every month.
| Table 1: Details may not equal totals due to rounding. | ||||||
Period | Total energy-related petroleum products (1) | Crude oil | ||||
| Quantity (thousands of barrels) | Value (thousands of dollars) | Quantity (thousands of barrels) | Thousands of barrels per day (average) | Value (thousands of dollars) | Unit price (dollars) | |
| 2004 | ||||||
| Jan.- Dec. | 4,917,568 | 174,463,145 | 3,820,527 | 10,439 | 131,699,875 | 34.47 |
| Jan.- Feb. | 773,000 | 23,063,082 | 597,291 | 9,955 | 17,230,625 | 28.85 |
| January | 393,790 | 11,612,214 | 309,437 | 9,982 | 8,835,252 | 28.55 |
| February | 379,209 | 11,450,868 | 287,854 | 9,926 | 8,395,373 | 29.17 |
| March | 431,545 | 13,722,675 | 331,653 | 10,698 | 10,161,735 | 30.64 |
| April | 393,904 | 12,666,573 | 311,914 | 10,397 | 9,668,379 | 31.00 |
| May | 396,796 | 13,739,077 | 316,256 | 10,202 | 10,473,706 | 33.12 |
| June | 434,959 | 15,218,210 | 346,490 | 11,550 | 11,697,207 | 33.76 |
| July | 408,626 | 14,177,570 | 318,789 | 10,284 | 10,610,712 | 33.28 |
| August | 430,232 | 16,080,613 | 331,185 | 10,683 | 12,043,670 | 36.37 |
| September | 388,526 | 14,971,323 | 303,605 | 10,120 | 11,421,201 | 37.62 |
| October | 411,620 | 17,686,358 | 315,811 | 10,187 | 13,197,932 | 41.79 |
| November | 434,953 | 17,672,558 | 326,477 | 10,883 | 13,434,691 | 41.15 |
| December | 413,409 | 15,465,106 | 321,056 | 10,357 | 11,760,015 | 36.63 |
| 2005 | ||||||
| Jan.- Feb. | 806,200 | 30,174,300 | 619,731 | 10,504 | 22,352,499 | 36.07 |
| January | 416,368 | 15,226,958 | 322,803 | 10,413 | 11,410,258 | 35.35 |
| February | 389,832 | 14,947,342 | 296,929 | 10,605 | 10,942,242 | 36.85 |
Specifically, I would like to draw everyone's attention to and contrast the two red lines in table 1 - those of November 04 and February 05. Contrasting these two months with one another, we can clearly see that - according to the government's score keeping - the price of imported oil "DROPPED" somewhere in the magnitude of 10 % from Nov. 04 to Feb. 05? By all appearances, this seems to me to be a conundrum if there ever was one, doesn't it?
1. A riddle in which a fanciful question is answered by a pun.
2. A paradoxical, insoluble, or difficult problem; a dilemma: "the conundrum, thus far unanswered, of achieving full employment without inflation" (Arthur M. Schlesinger, Jr.).
What I find so interesting, and in fact incredulous, is that - intuitively - I know in my heart of hearts - it sure didn't feel like there was any decline over the time period in question. What I find so bothersome, though, is that I now feel compelled to empirically prove what I intuitively feel to be true - somewhat like proving the sky is blue - so here goes.

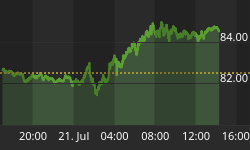
From empirical observation, we can graphically see [on the accompanying chart] that the price of crude [WTI] on the NYMEX Exchange looked much the same in the two months in question with prices ranging from about U.S. 45.00 on the low end to roughly U.S. 52.00 on the high side. So, for the month of February we have the government recording an official price for imported crude oil [36.85] somewhere between 10 and 16 dollars lower than prices observed on the NYMEX Exchange for sweet crude.
Sweet Vs. Sour?
All crude is not created equal. To back up and explain this claim, I would like to share with you a snippet from an article that was published in the Washington Times titled, Sour Crude Oil Sweetens Profits For Refineries:
"Like bartenders putting cheap alcohol into their cocktails, some U.S. refiners are reaping huge profits by using lower quality crude oil to make everything from gasoline to diesel. The difference is that, unlike martinis mixed with barnyard booze, these finished fuels, after a little extra work, are the same quality as those made with top-shelf ingredients and therefore fetch the same high price from consumers. But the initial cost per barrel is $7 to $17 cheaper....."
The article cited here points out that the 'spread' between the prices of sweet and sour crude is dynamic - meaning it moves. The above proposition brings with it the notion that the existing infrastructure of refineries is capable of handling increased quantities of lesser grade crude - which is perhaps a dubious assumption? While the price of NYMEX sweet crude oil is perhaps the most widely recognized and referred to benchmark price for crude oil in the Americas, the international oil trade does consist of dozens of grades and many transactions occur in lesser grades of heavier or sour grades of crude. So let's examine the price differentials between sour/heavy grades of Brent Crude for the two months in question.
| Table 2 Brent, Sour Crude Oil Futures - Settlement Price [Weekly NYMEX Settlement Prices] Nov. 04 vs. Feb. 05 | ||
| Year.Mn.Day | Price | Date |
| 2005.01.14 | 45.150 | Feb05 |
| 2005.01.07 | 43.100 | Feb05 |
| 2004.12.31 | 40.460 | Feb05 |
| 2004.12.31 | 40.480 | Feb05 |
| 2004.10.08 | 49.760 | Nov04 |
| 2004.10.01 | 46.290 | Nov04 |
| 2004.09.24 | 45.430 | Nov04 |
| 2004.09.17 | 42.440 | Nov04 |
Admittedly, yes there is a difference - Feb. 05 prices were lower than Nov. 04 - so I've learned something. But note that in both subject months, lesser grade Brent Sour Crude - as reported on NYMEX - is still well in excess of official government benchmark prices, namely 41.15 for Nov. 04 and 36.85 for Feb. 05. At first blush, it may seem that a portion of the price discrepancy [to the tune of a few bucks] between official U.S. Government prices for a barrel of crude oil and what we are fed in the financial press may be accounted for by a widening sweet/sour crude oil spread. That is, of course, until we factor in the following from the Energy Bulletin:
"....Oil prices have also risen for a variety of other factors over which OPEC has no control, according to Adkins. Tanker prices haven jumped from $3 a barrel to $10 a barrel during the recent run-up in crude prices. To increase output, Saudi Arabia has been selling lower grade crude, which has boosted the price of more desirable light, sweet crude. And the falling dollar has effectively cut the value of oil payments to OPEC producers....."
My take on this is that the global crude oil infrastructure is a daisy chain chock full of choke points or bottlenecks - it's not simply a story about the rise and fall of demand. Firstly, there are different grades of crude with different chemical compositions. Overall, there is not enough refining capacity to handle the marginal barrel of oil - which tends to be heavy or sour since the oil fields that produce 'light sweet' crude [like Gahwar, alleged to be the world's largest in Saudi Arabia] have reached 'peak oil' and are [or will soon be] in decline. Furthermore, according to pundits, building new refineries is typically a 5 to 10 year proposition. America currently consumes 20 - 21 million barrels of oil per day. Table 1 above shows that imports constitute somewhere between 10 and 13 million of those barrels.
Then there's the tanker fleet and pipelines that bring the oil to market. Hurricanes and the resulting high seas in the Gulf of Mexico in the fall of 04 resulted in damage to drilling rigs as well as the underwater oil pipeline grid that effectively 'shut in' oil and gas supply from the Gulf. The resulting damage led to supply disruptions at Louisiana refineries, and taxed the existing tanker fleet to make up the difference from further abroad. This ultimately led to higher prices. The reality highlighted here only exposes one of the many weak links in the supply chain. It shows what happens when the global tanker fleet is taxed and it tries to 'ship' via tanker the marginal barrel of 'cheaper sour crude' from places like Saudi Arabia - namely - shipping costs skyrocket because there are perhaps not enough tankers? This offsets the cheaper price paid to producers of lower grade crude implying an even more inflated cost to the consuming nation.
When viewed in this light, the prices being reflected in official U.S. Government statistics for the cost of a barrel of imported crude oil make little sense at all. The U.S. Government must pay their freight to ship oil like everyone else. What this means to me is that the official prices being recorded by the BEA should indeed be much closer to the prices we empirically observe for benchmark NYMEX crude oil - or 8 to 10 dollars per barrel more than the U.S. Government shows. Obviously, a crude oil price 8 - 10 dollars more per barrel would make a further shambles of the already dismal U.S. balance of trade numbers which were reportedly a 61 billion dollar deficit with 11 billion of that [in bold print in the table 1 above] being attributable to oil imports. 8 - 10 dollars more per barrel of crude oil would have added approximately 3 billion more to the trade deficit. If reported, how do you all think that would have impacted the bond market and the dollar? Also, the accompanying effect on the 'official' inflation rate would be nothing short of horrendous. Pilfering Pirates perhaps? Maybe this helps explain why this squeaky wheel gets no oil?

Artwork/Design courtesy of Mary Puplava: www.Financialsense.com


