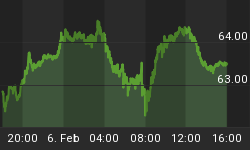
The Sigma Whole Market Index is right on the green horizontal support. If this support is breached, there is a high probability that we will decline until the next horizontal support (pink line) in coming sessions. But after recent consolidation, we can also imagine that the market could rebund from current levels and retest recent highs.

Looking at the CAC40, we can see the same pattern than for the US market. The index is right on the red horizontal suport, and if this support doesn't hold on, we will probaby decline until the next horizontal support (green line).

Looking at our ST model, we can notice that the Trend Level(TL) is at '1' (oversold). So, if we get a Swing at '4' or '5' on Monday, this will generate a 'buy' signal.

Looking at the different index we track, there is no change at this time: The CAC is in 'sell' while all other indexes are 'stop':


Trading Book:
Our short position on the NDX is still alive because our stop was at 3055 (5pts above the model).
- SPX: no position at this time (model is 'stop')
- NDX: 1 short at 3022.04 (stop @ 3055, 5pts above the model to take into account bid/ask spread)
- CAC: 1 short at 4016.98 (stop @ 4110, 5pts above the model to take into account bid/ask spread)
- DAX: no position at this time (model is 'stop')
For those of you interested in our analysis, you can visit our internet site: we post all our trades in real time. You can also subscribe to our twitter account (@SigmaTradingOsc), it is free and you are updated on our latest view/trades.


