• 967 days Will The ECB Continue To Hike Rates?
  • 968 days Forbes: Aramco Remains Largest Company In The Middle East
  • 969 days Caltech Scientists Succesfully Beam Back Solar Power From Space
  • 1,369 days Could Crypto Overtake Traditional Investment?
  • 1,374 days Americans Still Quitting Jobs At Record Pace
  • 1,376 days FinTech Startups Tapping VC Money for ‘Immigrant Banking’
  • 1,379 days Is The Dollar Too Strong?
  • 1,379 days Big Tech Disappoints Investors on Earnings Calls
  • 1,380 days Fear And Celebration On Twitter as Musk Takes The Reins
  • 1,382 days China Is Quietly Trying To Distance Itself From Russia
  • 1,382 days Tech and Internet Giants’ Earnings In Focus After Netflix’s Stinker
  • 1,386 days Crypto Investors Won Big In 2021
  • 1,386 days The ‘Metaverse’ Economy Could be Worth $13 Trillion By 2030
  • 1,387 days Food Prices Are Skyrocketing As Putin’s War Persists
  • 1,389 days Pentagon Resignations Illustrate Our ‘Commercial’ Defense Dilemma
  • 1,390 days US Banks Shrug off Nearly $15 Billion In Russian Write-Offs
  • 1,393 days Cannabis Stocks in Holding Pattern Despite Positive Momentum
  • 1,394 days Is Musk A Bastion Of Free Speech Or Will His Absolutist Stance Backfire?
  • 1,394 days Two ETFs That Could Hedge Against Extreme Market Volatility
  • 1,396 days Are NFTs About To Take Over Gaming?
  1. Home
  2. Markets
  3. Other

The State of the Trend

Last week we identified the SPX 2007 high as the key level to keep an eye on, and as a litmus test of whether Bernanke's words are doing more harm than good.

SPX Chart

As soon as the SPX dropped below that level, the FED started backpedalling and dragging out FED heads to soothe the markets. Although a similar strategy can be successful for only so long, desperate times call for desperate measures.

From a cyclical point of view, there is a clear historical precedent for what may happen if the stampede for the exit gets out of control:

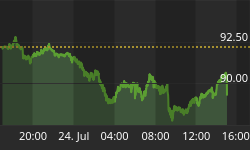
The mid-week rally fizzled within the May 3rd gap zone, better visible on an intraday SPY chart:

Moving back to the daily SPX, this creates very clear pivot levels for the days ahead: bullish above 1620, neutral between 1576 and 1620, and bearish below 1576.


Back to homepage

Leave a comment

Leave a comment