


With stocks posting gains Monday and early in Tuesday's trading, it appears as if investors are taking the glass half full approach to earnings season. The primary driver in the coming weeks will be the forward-looking statements that accompany earnings reports. From Bloomberg:
"A positive earnings season would help in an environment where data may still not provide an obvious picture of the U.S. economy," said Luca Paolini, who helps oversee about $66 billion in equities as chief strategist at Pictet Asset Management Ltd. in London. "Profit margins have proven to be relatively resilient. The most critical issue we are looking at is company guidance for the next few quarters."
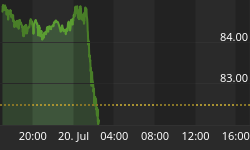
On Monday, we noted the importance of how the S&P 500 acts near 1643. Below is an updated version of the chart as of 11:15 AM EDT Tuesday. The relevance of the thin colored moving averages is described in this segment from last weekend's video.

Central Banks Not Rushing To Remove Punch Bowl
After the markets reacted negatively to the hypothetical tapering plan from the Fed, the central bank was quick to point out they have no imminent plans to begin a traditional campaign to increase interest rates. The Wall Street Journal touched on the possibility of a targeted bubble control approach that may be adopted by global central banks:
Ben Bernanke and his counterparts around the world, seared by the worst financial crisis in 75 years, are searching for ways to halt borrowing binges before they morph into bubbles, and to push lenders to shore up their defenses before the next crisis arrives. Lifting interest rates to discourage borrowing has long been considered a blunt but effective weapon. But that isn't a step central banks are eager to take when inflation is low or unemployment is high--as they are in many places now. So some central bankers are experimenting with targeting only pockets of financial excess. Because financial bubbles so often involve real estate--and because that sector was at the center of the last crisis--many are focusing on ways to control booms in housing prices by curbing mortgage lending.
Housing Could Be Target
It appears as if market participants fear a bubble targeting approach could negatively impact home builders. The market leadership provided by home builders in 2012 has been absent noticeably over the past three months. The chart below shows the performance of home builders (XHB) relative to the general stock market (SPY). When the ratio falls (black line), it shows waning demand for home builders relative to the broader stock market.

Investment Implications
As the chart shows below, stocks have done something they have not been able to do over the past twelve years; break out above long-term resistance. This tells us to respect the possibility of further upside from a longer-term perspective.

The intermediate-term outlook has been somewhat cloudy since the tapering-induced scare hit the global financial markets. The opening chart in this article showed possible improvement from a short-term perspective (daily chart). The chart below shows possible improvement from an intermediate-term perspective (weekly chart).

If the S&P 500 can remain above its 50-day moving average (1628) and 1643, we will listen to our market model and take another incremental step back toward risk. Areas where we may redeploy some cash include broad positions, such as the total stock market (VTI), or leading sectors, such as small caps (IWM), financials (XLF), and consumer discretionary (XLY). Should the S&P 500 retreat below its 50-day moving average, our short-term bias would become more defensive.


