• 722 days Will The ECB Continue To Hike Rates?
  • 722 days Forbes: Aramco Remains Largest Company In The Middle East
  • 724 days Caltech Scientists Succesfully Beam Back Solar Power From Space
  • 1,124 days Could Crypto Overtake Traditional Investment?
  • 1,129 days Americans Still Quitting Jobs At Record Pace
  • 1,131 days FinTech Startups Tapping VC Money for ‘Immigrant Banking’
  • 1,134 days Is The Dollar Too Strong?
  • 1,134 days Big Tech Disappoints Investors on Earnings Calls
  • 1,135 days Fear And Celebration On Twitter as Musk Takes The Reins
  • 1,137 days China Is Quietly Trying To Distance Itself From Russia
  • 1,137 days Tech and Internet Giants’ Earnings In Focus After Netflix’s Stinker
  • 1,141 days Crypto Investors Won Big In 2021
  • 1,141 days The ‘Metaverse’ Economy Could be Worth $13 Trillion By 2030
  • 1,142 days Food Prices Are Skyrocketing As Putin’s War Persists
  • 1,144 days Pentagon Resignations Illustrate Our ‘Commercial’ Defense Dilemma
  • 1,145 days US Banks Shrug off Nearly $15 Billion In Russian Write-Offs
  • 1,148 days Cannabis Stocks in Holding Pattern Despite Positive Momentum
  • 1,149 days Is Musk A Bastion Of Free Speech Or Will His Absolutist Stance Backfire?
  • 1,149 days Two ETFs That Could Hedge Against Extreme Market Volatility
  • 1,151 days Are NFTs About To Take Over Gaming?
Billionaires Are Pushing Art To New Limits

Billionaires Are Pushing Art To New Limits

Welcome to Art Basel: The…

How The Ultra-Wealthy Are Using Art To Dodge Taxes

How The Ultra-Wealthy Are Using Art To Dodge Taxes

More freeports open around the…

Is The Bull Market On Its Last Legs?

Is The Bull Market On Its Last Legs?

This aging bull market may…

  1. Home
  2. Markets
  3. Other

AUD/USD: Testing its Previous Low

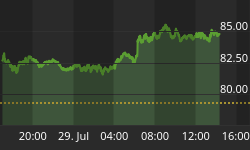
AUD/USD is moving si d eways since 20 June. However, monitor the test of the recent low at 0.8999. Hourly resistances can be found at 0.9101 (intraday high) and 0.9129 (25/07/2013 low).

In the medium-term, the break of the strong support at 0.9388 (04/10/2011 low) opens the way for a further medium-term decline. The break to the downside out of the long-term symmetrical triangle (see the daily chart) suggests a move towards 0.8236. Key supports are at 0.8771 and 0.8067. Key resistances stand at 0.9345 (26/06/2013 high) and 0.9666 (14/06/2013 high).

Daily Technical Report


Read the Report

Back to homepage

Leave a comment

Leave a comment