


The great news today is that mortgage delinquencies dropped to their lowest level in five years. Look at the chart (source: Bloomberg)! Doesn't it look great?

This was actually a bit surprising to me. With the Unemployment Rate doing about what it usually does in recoveries, and the economy adding something a bit shy of 200,000 new jobs per month, and with interest rates low and housing prices rising, you would think that delinquencies would have improved much more than they have.
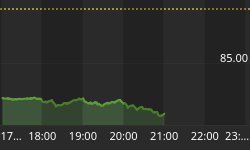
Pretty much all of the delinquency data looks the same way. Here is a chart of new foreclosure actions as a (seasonally-adjusted) percentage of total loans.

While well off its highs, this would have been a record level just a few years ago.
Is this a symptom of the " part-time America" phenomenon, in which all of these new jobs are being generated as part-time work, so that the improvement in the lot of the average worker is not paralleling the improvement in the jobs or unemployment rate numbers? (I'm not disputing that such a phenomenon exists; in fact I think it does. I am asking whether this is a symptom of that, or if there is another cause?) In any event, it isn't a very good sign, and is one reason that even once QE ends, the Fed will endeavor to keep rates low for a very long time.
By the way, it also makes me wonder whether the celebrated move of institutional investors into the private residential real estate market is having a smaller effect than many people think it is. If there were big players looking to buy bank REO on the offered side, then wouldn't you think banks would be accelerating foreclosures and that the delinquencies would be dropping faster (as homeowners either get into the foreclosure process, whereupon they aren't in the delinquency stats, or get serious about becoming current)? I don't know the answer.
.
Here is a technical point for institutional investors in inflation-indexed bonds and/or swaps - something worth watching for.
There has been much concern in some quarters recently about the coming increase in demand for high-quality collateral to back swaps under Dodd-Frank regulations. One way this could manifest in the inflation markets is to narrow the spread between inflation "breakevens" and inflation swaps. As the chart below (Source: Enduring Investments) illustrates, the inflation swaps curve is always above the " breakeven" curve. In theory, both curves should be measuring the same thing: aggregate inflation expectations over some period.

And, in fact, they do. But while the inflation swaps market is a relatively-pure measure of inflation expectations, breakevens have some idiosyncrasies that make them less useful for this purpose. Predominant among these idiosyncrasies is the fact that nominal Treasury bonds act in the market as if they are very, very good collateral and so often trade at " special" financing rates. That is, when you buy a Treasury bond you not only buy a stream of cash flows, but you pay a little extra for it since you can borrow against it at attractive rates sometimes (if you are an investor who does not utilize the bonds for collateral, then you are paying for this value for no reason). However, TIPS are much more likely to be " general" collateral, and to offer no special financing advantage. There is no fundamental reason for this: TIPS are Treasuries, and are just as valuable as collateral to post as margin as are nominal Treasuries. There just isn't a deep short base, and the main owners of TIPS are inflation-linked bond funds that actively repo them out so that they are rarely in short supply. It is unusual, although no longer unprecedented, to see a TIPS issue trade special.
The consequence of this is that Treasury yields are lower than they would otherwise be, by the amount of the " specialness option," and TIPS yields are not affected by the same phenomenon. Therefore, breakevens are lower than they would otherwise be.
If, in fact, there becomes a shortage of " good" collateral to use to post as swaps margin, one place I would expect that to show up would be in the TIPS market. I would expect that TIPS issues would begin to go on special more-frequently, and to start to behave like the good collateral they are. The consequence of that would be to cause TIPS yields to decline relative to nominal yields as they gain the " specialness option,", and for breakevens to rise towards inflation swap levels. (As an aside, that would also cause TIPS asset swaps to richen of course).
A long time ago, I summarized this argument here,[1] and a slightly more-rigorous draft of a paper is here.[2]
As I said, this is a technical point and not something the non-institutional investor needs to worry about.
[1] I am bound to include this notice with any online use of the article: "This article was originally published in The Euromoney Derivatives & Risk Management Handbook 2008/09. For further information, please visit www.euromoney-yearbooks.com/handbooks."
[2] Frankly, I need to update this paper and get it published, but the last time I submitted it I had one referee tell me " this is wrong" and the second referee said " this is obvious" so I decided in frustration to let it drift.
You can follow me @inflation_guy!
Enduring Investments is a registered investment adviser that specializes in solving inflation-related problems. Fill out the contact form at http://www.EnduringInvestments.com/contact and we will send you our latest Quarterly Inflation Outlook. And if you make sure to put your physical mailing address in the "comment" section of the contact form, we will also send you a copy of Michael Ashton's book "Maestro, My Ass!"


