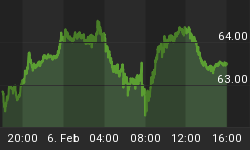
Gold finished Friday up $1.50 on light volume to 1313.50, with silver up $0.30 to 20.51 on good volume. The gold/silver ratio dropped to 64.04, below its 50 day MA. Gold is at its 50 day MA while silver closed above its 50 day MA for the first time since Feburary 6 2013. Over the past week, silver has clearly outperformed gold and it closed right at the top of its trading range.
Over the week gold is up $0.70 [+0.05%] while silver is up $0.67 [+3.38%].
Assisting gold this week was the dollar, down -0.85 [-1.03%] to 81.15. Given that gold didn't rise, and the dollar dropped, that would normally not be a very good sign. However silver moved up and eventually it should drag gold up along with it. This week it appeared that the taper/don't-taper thesis primarily drove futures gold prices, while silver futures seemed to be linked more closely to movements in copper and economic developments in China.
The gold/silver ratio, for me, is a good indicator of the trend in PM overall. Here we see how the gold/silver ratio has consistently been above its 20 EMA (green line) ever since the PM downturn started back in Feb 2013. Over the past week, gold/silver ratio crossed not only its 20 EMA but its 50 MA (blue line) as well, a dramatic move that hasn't happened for literally six months. If it can stay below that 50 MA, it is a very significant sign of a trend change, as silver typically leads gold on the way up.

Mining shares had an eventful week - down hard early in the week, and up even more strongly on Thursday and Friday. Silver mining shares did especially well. Early-week downside moves in the silver miner names I watch were on relatively moderate volume, while the upside moves on Thursday and Friday had heavy volume. Volume is the indicator I use to tell how authentic a move is, so down on moderate volume and up on heavy volume is quite bullish. I interpret this as there being relatively few sellers left to bail out, and a whole lot of buyers (and/or shorts covering) that are coming in. This matches up with the extremely poor sentiment in both PM and the miners. There are few people left to sell, which is what you need at reversal points.
Medium/Long Term Fundamentals
These fundamental indicators cover what I'll call the medium to long term timeframes. Rather than impacting futures market prices tomorrow, they are likely to affect futures market prices anywhere from 1-6 months from now.
Seasonally, June & July are weak months for gold; August, September and then November-February are stronger. Bias should be up for the next few months.
Sentiment in gold & mining shares continues to be poor, a contrary bullish indicator.
Physical Supply Indicators
* Gold premiums in Shanghai increased $2.70, closing the week at a premium of $13.65.
* The GLD ETF lost -7.51 tons of gold this week. Interestingly, GLD actually gained +1.8 tons of gold on Friday for the first time in months.
* The COMEX lost -3.66 tons of gold this week, percentagewise a much larger move. It too gained a small amount of gold on Friday.
* LBMA GOFO rates dropped to a new cycle low this week, with the 1 month GOFO rate moving from -0.06% down to -0.12%.
Taken together, this paints a picture of a tight physical supply situation at current prices.
Futures Positioning
The COT report shows the Producer category (miners & bullion banks - thought of as "smart money") went long/covered 9840 contracts, moving to an almost-flat position for the first time in the history of this timeseries going back to mid-2006. This continues to be a very bullish indicator.
Moving Average Current Trends
Gold: short term UP, medium term DOWN, long term DOWN
Silver: short term UP, medium term DOWN, long term DOWN
Silver price moved above its 50 day MA for the first time in six months. The Gold/Silver ratio moved below its 50 day MA for the first time in 6 months. Both of these are bullish indicators.
Conclusion
Physical supply indicators suggest demand for physical gold is still outpacing available supply at current prices, even with India imposing import taxes, and Pakistan banning gold imports. Together with seasonal upward biases, Producers continuing to head towards a net long futures position for the first time ever, sentiment in miners and metal remains poor (a contrary indicator). Taken all together, this suggests to me there is an upward bias in the price of PM coming from the fundamental factors.
Silver's price action vs gold this week also indicates a possible trend change, as do silver mining share prices.
While the current medium and long term trends remains down, I'm becoming more certain we have seen the lows at 1180. The primary risk I see is that of the dollar. If the buck moves back up towards 85, as might happen with any renewed crisis, we could see the futures markets bail out of PM very rapidly, regardless of the rest of the fundamental indicator, trends and the like.
Note: If you're reading this and are not yet a member of Peak Prosperity's Gold & Silver Group, please consider joining it now. It's where our active community of precious metals enthusiasts have focused discussions on the developments most likely to impact gold & silver. Simply go here and click the "Join Today" button.


