


Update 9th of September 2013


Arguments for lower prices:
- Gold overall still in a downtrend. US$1,525.00 is the line in the sand. Gold will need much more time to break through this heavy resistance.
- MACD sell signal on monthly chart still active.
- New MACD sell signal on the daily chart.
- HUI Gold Bugs Index did not confirm Gold's recent high at US$1,432.00.
- Still excessive optimism in HUI Gold Bugs sentiment according to latest sentiment report.
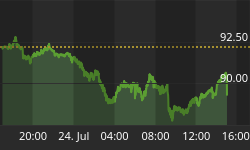
- US-Dollar at 50-MA (82.28) support on the daily chart and above 200-MA (81.68).
- US stock market looks toppy and in distribution mode. Situation smells like 1987. If stock markets starts crashing precious metals might get into troubles as well (risk off).
Arguments for higher prices:
- MACD buy signal on the weekly chart.
- Gold is above 50-MA (US$1,321.97). Next target automatically and naturally is the 200-MA (US$1,498.60).
- Gold retested old highs around US$1,355.00 on Friday and strongly reversed higher.
- Gold's daily chart clearly shows a new up trend with 4 waves since the June lows. Currently wave 4 is about to finish or has already been finished last friday. Wave 5 (in commodities often the sharpest one) should take gold towards US$1,500.00.
- CoT-Data for Comex Gold: commercial short position still very low.
- The seasonal cycle for precious metals remains extremely positive. September statistically best month of the year.
- For the first time in 2013 Gold is going up versus all four major world currencies at once, this is a very strong buy-signal.
- Only mild correction in the mining stocks so far.
- US$ at bollinger band resistance (82.56) on the daily chart.
- Bond yield reaches a 2 year high. The 10-year treasury note yield cleared 5 five-year resistance and psychologically important level at 3%. In this environment Gold might be acting as safe haven.
Conclusion:
- Scenario 1 from my last analysis played out perfectly so far.
- Most likely scenario now is that Gold will soon move up above US$1,400.00 again and start challenging recent highs at US$1,425.00-US$1,430.00. I expect some more days of wild swings & confusion before gold will be able to clear this resistance. Next target will be US$1.475 and US$1,500.00.
- Due to the very positive seasonality Gold should rise at least to US$1,500.00 until end of September (maybe even US$1,525.00). After reaching this massive resistance zone around US$1,500.00 I expect Gold to start correction back down to 50-MA (US$1,321.97).
- If Gold is closing below US$1,355.00 new up trend has to be questioned and all short-term bets should be off the table.
- The probability is very high that we have seen the final low for this 2 year-correction in Gold at US$1,180.00 on June 28th. Next important zone is the strong resistance around US$1,525.00. Gold is a strong trading sell on the first two attempts to get over this level. The third or fourth attack should be successful but should not happen before early 2014. I do not expect any new all time highs in Gold before summer/autumn 2014.
Long term:
- Nothing has changed
- Precious Metals bull market continues and is moving step by step closer to the final parabolic phase (could start in summer 2014 & last for 2-3 years or maybe later)
- Price target DowJones/Gold Ratio ca. 1:1
- Price target Gold/Silver Ratio ca. 10:1
- Fundamentally, Gold is now starting to move into the final 3rd phase of this long term bull market. 1st stage saw the miners closing their hedge books, 2nd stage continuously presented us news about institutions and central banks buying or repatriating gold. The evolving 3rd and finally parabolic stage will end in the distribution to small inexperienced new investors who will be subject to blind greed and frenzied panic.


