


Confidence In Stocks & Economy: Then And Now

In this weekend's article, we tackle three major topics that may alter the way you invest:
- How the Fed impacts asset prices.
- The market does not care what you think.
- Using concepts 1 & 2 to compare 2007 and 2013.
Why Is Wall Street Obsessed With The Fed?

Before we move to the "you decide" comparisons of 2007 and 2013, it is important to acknowledge the Federal Reserve's method for propping up asset prices. The Fed provides a difficult-to-overstate source of indirect demand for financial and physical assets. Here is basically how quantitative easing (QE) works: The Fed prints money, they give the printed money to primary dealers, the Fed gets a bond in return, and presto they have injected new money into the global financial system without having to deal with messy stimulus votes in Washington. The primary dealers (and/or their clients) can do whatever they want with the freshly printed greenbacks, including purchasing stocks, distressed real estate, or anything their hearts desire. That, my friends, is how stocks can go up when the economy is in such a tepid state and why Wall Street is obsessed with the Fed's printing presses. If you want to do some homework over the weekend, this series of videos will allow you to enter the top 1% in terms of understanding what, why, and how the Fed does what it does.
Fed Was Tightening In 2006-2007
Many believe QE is some radically new method of stimulating the economy. QE is really no different than normal open market operations the Fed has used to adjust interest rates for decades. The only significant difference is QE takes place when interest rates are already near zero; which places QE into the pure money printing category. If you want to find one immensely important difference between Q3-Q4 2007, when the stock market peaked, and October 2013, look no further than Fed policy. In 2006 the Fed raised interest rates four times, which takes the QE process and puts it in reverse. QE sees the Fed swap cash for a bond. When the Fed was raising interest rates in 2006, they were swapping bonds for cash, meaning they were draining "liquidity" from the global financial system in 2006-2007.

2013: Instead Of Draining, The Fed Is Injecting
If we fast forward to the present day, Fed policy involves pumping billions of dollars into the financial system each month. From Bloomberg:
After flirting for months with the idea of curtailing stimulus, the Fed said in September it would continue purchasing $85 billion of bonds a month, citing the need to see more evidence that the U.S. economy will improve.
Reading The Market's Palm
Technical analysis (TA) is the study of charts. TA often gets slumped together with voodoo and palm reading. The power of charts, and why they are used by the vast majority of pension funds, is they allow us to monitor the mechanism that sets asset prices. If you understand how assets prices are set, then the value of monitoring charts is easy to understand.
A Different Way To Approach Investing

Let's assume we run a controlled market experiment where:
- We give 1,000 investors an annual report to read for company XYZ.
- All 1,000 are asked to read the report and then value the stock.
- Stock XYZ can only be traded or owned by these 1,000 investors.
The Market Does Not Care What You Think
If I am one of the 1,000 investors in the experiment, how relevant is my personal opinion in terms of how the price of stock XYZ is set in the marketplace? In simplified terms, my personal take on the value of XYZ impacts the price by roughly 0.10% (1/1000). Stated in a politically correct manner, 99.9% of the factors impacting the price of XYZ have nothing to do with my personal analysis, forecast, or opinion about XYZ, or the global macro environment for that matter. Said in a more direct manner, the market does not care what "I think" about where XYZ is headed or what it is worth. It sounds harsh, but that is the way markets work. Does that mean fundamentals don't matter? Absolutely positively not; the concept simply defines how fundamentals impact asset prices.

If we expand the XYZ analogy to the real world, it gets even more humbling. Facebook (FB) trades 81,000,000 shares on a typical day. It closed Thursday at $52.44. If we assume the average FB trade is for $10,000 worth of stock, that means the average number of shares traded per individual transaction is 190 (10,000/52.44). A back of the napkin estimate of the number of people that trade Facebook every day comes to 426,315 (81M shares per day / 190 shares per individual transaction). Therefore, if I am trading Facebook, the impact of my personal opinion/research/forecast on the price of the stock is 1 divided by 426,315 or 0.00023%. The admittedly crude analysis tells us 99.977% of Facebook's value is impacted by external factors that are in no way impacted by what "I think" or "what I think will happen next".
So What Do We Do Now?
In terms of using this information to become better investors, let's start with the proper questions to ask before we allocate our limited resources. If a client or prospect asks what do you think about Coca-Cola (KO)?, we often respond with you may not be asking the right question(s). The more meaningful way to phrase the question is what does the market think about Coca-Cola, and how does that compare to every other investment option? Charts allow us to answer both questions.

Question two: Is Coke the best investment option? At this point, the answer is a definitive no, according to the chart below. If Coke is lagging the S&P 500 that means numerous stocks in the S&P 500 are better options relative to how assets are priced. The chart tells us the aggregate opinion of SPY is more favorable that the aggregate opinion of KO.

How Fearful Is The Market Now?
The market's pricing mechanism, based on the aggregate opinion of every investor around the globe, allows us to compare economic confidence in late 2007 to the present day. If you prefer, a more direct way to say it is charts enable us to monitor the conviction that stocks will push higher relative to the conviction that stocks will fall. The aggregate investor opinion is based on the aggregate interpretation of the economy, earnings, Fed policy, etc. The previous sentence helps us understand the concept that the fundamentals are reflected in the charts.
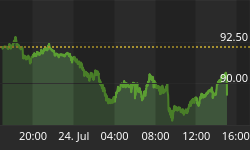
2007 vs. 2013
The S&P 500, or price, is like an economic poll where investors vote with their wallets. The blue line in the charts below is the 50-day moving average, which is used to filter out day-to-day volatility, allowing us to focus on the intermediate-term trend of investor confidence. It is easy to see the present state of economic/market confidence is much healthier than it was in 2007 (compare the first chart to the second).

How About The Longer-Term Confidence Polls?
If we want to get a read on the longer-term aggregate battle between confidence in the economy/Fed/stocks relative to concerns about the economy/Fed/stocks, we can use the 200-day moving average (in green below). The slopes of the blue lines allow us to compare the 2007 bull market peak to the present day. The consolidation, which shows indecisiveness about the economy, between April 2007 and December 2007 (points A and B) tells us the aggregate opinion of millions of market participants does not flip from bullish to bearish overnight. If we pull that concept into 2013, the current slope of the 200-day moving average tells us, even under the most bearish longer-term scenarios, months of sideways price action would most likely come before any significant and lasting plunge in stock prices (likely speaks to probabilities).

Time Stamped Historical Example
This all sounds logical, but can it help us? The excerpt below comes from an article we published on Seeking Alpha in early February 2008, when the S&P 500 was trading at 1367. The S&P 500 eventually bottomed at 666 in March 2009 (51% drop). The point is the methods described above add value and can help protect your hard-earned principle.
"Based on recent technical breakdowns in many risk-based investments, the probability of investors incurring additional losses over an extended period of time has increased. Both the technical and fundamental outlook now favors bearish outcomes over bullish outcomes."
Investment Implications
Before we discuss how the charts above will impact our 2013 allocation strategy, it may be helpful to review the four tenets of investment success we covered on October 18:

- Think in probabilities
- Develop an IF, THEN system
- Monitor the big picture
- Remain highly flexible
The charts above tell us the probability of a bear market kicking off from a risk-tolerance profile similar to what we have today is relatively low. A relatively low probability does not mean a zero probability. Therefore, if the charts above begin to shift in a 2007-like manner and the big picture deteriorates significantly from this profile, we must maintain a degree of flexibility that allows us to tone down our exposure to stocks.
As of Thursday's close, our market model that tracks the health of the S&P 500 (and the aggregate opinion of all investors) was answering 90% of the binary questions asked with "bullish" and only 10% fell in the "bearish" category. An example of a binary question discussed in this article - is the slope of the S&P 500's 200-day positive? The response now is yes. The 90/10 split in our model tells us something has to change for the stock market bears. When might that happen? You'll have to ask the millions of investors around the globe. Rather than call them all, we can pay attention to the polling mechanism available to us (charts).
Where Is Aggregate Demand The Strongest?
The table below shows the results of comparing 130 of the most widely traded ETFs head-to-head, using a method similar to the KO vs. SPY chart above.

The observable evidence in the table above aligns will our holdings in the broad U.S. stock market (VTI), emerging markets (EEM), foreign stocks (EFA), and technology (QQQ). The October 10 tweet below highlights the role flexibility played in buying when fear of a U.S. debt default was still high.

The same flexibility will be required to manage our long positions going forward. While the cracks have not slipped into our models, recent investor demand for Treasuries (TLT) and conservative staples (XLP) represent visible examples of waning economic confidence.
Alpha And Omega
Unfortunately, the expression "it's all about the Fed" is not too far off base. Investors have heard talk of central banks cutting back on stimulus. While many will not be happy to hear this, the growing consensus on Wall Street is for more money printing, rather than less.
From Bloomberg:
"We are at the cusp of another round of global monetary easing," said Joachim Fels, co-chief global economist at Morgan Stanley in London. Policy makers are reacting to another cooling of global growth, led this time by weakening in developing nations while inflation and job growth remain stagnant in much of the industrial world.


