


I. The 24 month experiment I undertook in my August 31, 2003 communication is done. In the Monthly DJIA the two cases 4/28/78 and 5/30/03 are definitely NOT a pattern pair.

II. I will not update the Cycloops Chart and the line charts of its 2 coordinates (which I last updated in my March 14,2005 communication), or the Scatter Chart and the line charts of its 2 coordinates (which I last updated in my April 12, 2005 communication), or the line chart of Peter Eliades' CI-NCI Ratio.
III. Patterns in the Monthly DJIA are not explained by patterns in the Cycloops Chart or the Scatter Chart. I say this because the 9/30/42 case, which I showed in my June 10, 2003 communication to be similar to the 4/28/67 and 10/31/88 pattern pair with respect to the Cycloops Chart and the Scatter Chart, is surprisingly similar to the 5/30/03 case with respect to the Transformed Coppock Curve, which I introduced in my June 1, 2004 communication.

IV. And, more importantly, the 9/30/42 and 5/30/03 cases are similar in the Monthly DJIA itself.

V. Meanwhile, the 8/29/47 case, which I also discussed on June 10, 2003, and which shows similarity to the 1/31/63 and 8/31/82 cases with respect to the Cycloops Chart and the Scatter Chart, appears similar to that same pattern pair in the Transformed Coppock Curve and, to a lesser extent, in the Monthly DJIA.


VI. Given the foregoing, it seems that classifying the pattern of the Transformed Coppock Curve's path over the 31 months culminating in a deep or very deep buy signal is sufficient to predict the pattern class of the Monthly DJIA's path over the 48 months straddling such a signal. In other words, it seems that during the four years straddling a such a signal the Monthly DJIA is mainly some lagged function of the Transformed Coppock Curve.
VII. The ideal would be that the pattern class of the Transformed Coppock Curve's 31 month pre-signal path is sufficient to predict pattern class of the Monthly DJIA's 24 month post-signal path.
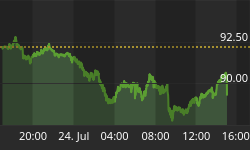
The following chart shows that the Coppock Curve is now approaching the zero line. In a year or two there will probably be another deep buy signal. At that time I, and anyone else caring to chart the Transformed Coppock Curve, may investigate this supposition further.


