• 678 days Will The ECB Continue To Hike Rates?
  • 678 days Forbes: Aramco Remains Largest Company In The Middle East
  • 680 days Caltech Scientists Succesfully Beam Back Solar Power From Space
  • 1,080 days Could Crypto Overtake Traditional Investment?
  • 1,084 days Americans Still Quitting Jobs At Record Pace
  • 1,086 days FinTech Startups Tapping VC Money for ‘Immigrant Banking’
  • 1,090 days Is The Dollar Too Strong?
  • 1,090 days Big Tech Disappoints Investors on Earnings Calls
  • 1,091 days Fear And Celebration On Twitter as Musk Takes The Reins
  • 1,092 days China Is Quietly Trying To Distance Itself From Russia
  • 1,093 days Tech and Internet Giants’ Earnings In Focus After Netflix’s Stinker
  • 1,097 days Crypto Investors Won Big In 2021
  • 1,097 days The ‘Metaverse’ Economy Could be Worth $13 Trillion By 2030
  • 1,098 days Food Prices Are Skyrocketing As Putin’s War Persists
  • 1,100 days Pentagon Resignations Illustrate Our ‘Commercial’ Defense Dilemma
  • 1,100 days US Banks Shrug off Nearly $15 Billion In Russian Write-Offs
  • 1,104 days Cannabis Stocks in Holding Pattern Despite Positive Momentum
  • 1,105 days Is Musk A Bastion Of Free Speech Or Will His Absolutist Stance Backfire?
  • 1,105 days Two ETFs That Could Hedge Against Extreme Market Volatility
  • 1,107 days Are NFTs About To Take Over Gaming?
The Problem With Modern Monetary Theory

The Problem With Modern Monetary Theory

Modern monetary theory has been…

Strong U.S. Dollar Weighs On Blue Chip Earnings

Strong U.S. Dollar Weighs On Blue Chip Earnings

Earnings season is well underway,…

  1. Home
  2. Markets
  3. Other

Intraday Elliott Wave Analysis For GOLD and E-Mini SP500

GOLD reversed through 1346 support so it seems that market reached a temporary high and that prices could stay sideways or move even lower in the next few days. We will keep an eye on minimum three waves down, but still need five sub-waves in wave (a) to confirm a bearish turning point back to 1329; termination point of fourth wave.

GOLD 1h

Gold 1-Hour Chart

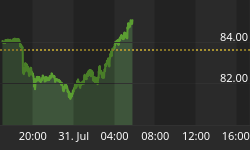
Our analysis on S&P Futures with a bullish view was on the spot lately, but now it may be time to consider a coming corrective reversal because price seems to be moving up in wave five. In fact, there was a triangle placed in wave four and we know that triangles occur prior to the final move of the larger pattern. If that is the case, then market is now in final part of current bullish trend so bearish reversal should not be a surprise. However, triangle measurement shows room for 1768/1770 before turning point occurs.

S&P Futures 1h

E-mini S&P500 Elliott Wave Analysis Intraday


FREE WEBINAR by EW-Forecast.com | Elliott Wave Principle and Live Analysis WEBINAR, Reserve Your Seat Now For Free >>> Here


Back to homepage

Leave a comment

Leave a comment