• 668 days Will The ECB Continue To Hike Rates?
  • 668 days Forbes: Aramco Remains Largest Company In The Middle East
  • 670 days Caltech Scientists Succesfully Beam Back Solar Power From Space
  • 1,070 days Could Crypto Overtake Traditional Investment?
  • 1,075 days Americans Still Quitting Jobs At Record Pace
  • 1,077 days FinTech Startups Tapping VC Money for ‘Immigrant Banking’
  • 1,080 days Is The Dollar Too Strong?
  • 1,080 days Big Tech Disappoints Investors on Earnings Calls
  • 1,081 days Fear And Celebration On Twitter as Musk Takes The Reins
  • 1,083 days China Is Quietly Trying To Distance Itself From Russia
  • 1,083 days Tech and Internet Giants’ Earnings In Focus After Netflix’s Stinker
  • 1,087 days Crypto Investors Won Big In 2021
  • 1,087 days The ‘Metaverse’ Economy Could be Worth $13 Trillion By 2030
  • 1,088 days Food Prices Are Skyrocketing As Putin’s War Persists
  • 1,090 days Pentagon Resignations Illustrate Our ‘Commercial’ Defense Dilemma
  • 1,091 days US Banks Shrug off Nearly $15 Billion In Russian Write-Offs
  • 1,094 days Cannabis Stocks in Holding Pattern Despite Positive Momentum
  • 1,095 days Is Musk A Bastion Of Free Speech Or Will His Absolutist Stance Backfire?
  • 1,095 days Two ETFs That Could Hedge Against Extreme Market Volatility
  • 1,097 days Are NFTs About To Take Over Gaming?
  1. Home
  2. Markets
  3. Other

GBP/USD And USD/JPY Intraday Elliott Wave Analysis

A deep retracement on GBPUSD to 1.6340 in the last 48 hours appears to be only one leg of minimum three wave set back. We reworked the wave count and now tracking an incomplete wave (iv) pullback that is expected to find a support with subwave c) somewhere around 1.6290/1.6310; at former wave iv). With that said, short term bias on GBPUSD suggests sideways or even bearish price action.

GBPUSD 1h

GBP/USD 1-Hour Chart

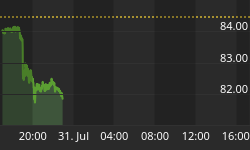
USDJPY made very deep retracement in the last two trading days which we firstly thought it will be wave (ii) and that wave 4 already found a base at 101.60. However, pair is actually moving sideways since start of December so we are now observing idea of an incomplete triangle. With that said, be aware of more sideways price action before going higher. Stocks are also weak, not helping USDJPY much.

USDJPY 1h

USD/JPY 1-Hour Chart


Written by www.ew-forecast.com
14-Day Free Trial


Back to homepage

Leave a comment

Leave a comment