


The dollar made a multiyear high, closing on Thursday at over 26mg gold! Not even the Fed's propaganda squad would trumpet this as good news and not in this way. And, of course, the gold bugs regard it as bad news. Though they say that the dollar is going to zero, they measure the value of their gold in dollars. They want their gold to "go up", perhaps so they can exchange it for more dollars. Isn't this an odd contradiction? In silver terms, the dollar was also up, to over 1.6 grams (this is not higher than in June when the dollar rose to almost 1.7g).
No matter, these prices are facts.
By the way, for those inclined to think that this is only the price of "paper" gold or silver, we have as much gold metal as you would care to buy at $1900 or $1600 or $1300, or whatever the demand for physical metal is supposed to be. Or we'll sell silver to all comers at $49 or $36 or $24, or whatever its physical demand price is alleged to be.
This brings us to the r'aison d'etre of this newsletter: to track the true supply and demand dynamics of these metals. We do this by looking at the difference between the price of "physical" and the price of "paper". These two prices are very close. To put it in perspective, the difference between the price for the active futures contract and physical gold metal is about 0.2% annualized, or 40 cents. The conspiracy theory alleges a monstrous disconnect between the mountains of paper contracts sold to push down the price of paper gold vs. the high-and-rising demand for physical.
The reality is that there is a worldwide bullion market out there, and it's full of sellers who are happy to sell you all the physical metal you want within a few pennies of the price of paper gold, i.e. gold futures. They will not be happy to exchange their gold for dollars at some point in the future, but for now they are. Since we are all users of the dollar system--and we will all be harmed by the collapse of the dollar--we should be happy that it's holding together for the time being.
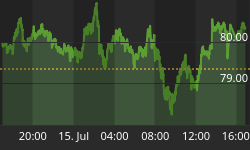
Here is the graph of the metals' prices.
The Prices of Gold and Silver

We are interested in the changing equilibrium created when some market participants are accumulating hoards and others are dishoarding. Of course, what makes it exciting is that speculators can (temporarily) exaggerate or fight against the trend. The speculators are often acting on rumors, technical analysis, or partial data about flows into or out of one corner of the market. That kind of information can't tell them whether the globe, on net, hoarding or dishoarding.
One could point out that gold does not, on net, go into or out of anything. Yes, that is true. But it can come out of hoards and into carry trades. That is what we study. The gold basis tells us about this dynamic.
Conventional techniques for analyzing supply and demand are inapplicable to gold and silver, because the monetary metals have such high inventories. In normal commodities, inventories divided by annual production can be measured in months. The world just does not keep much inventory in wheat or oil.
With gold and silver, stocks to flows is measured in decades. Every ounce of those massive stockpiles is potential supply. Everyone on the planet is potential demand. At the right price. Looking at incremental changes in mine output or electronic manufacturing is not helpful to predict the future prices of the metals. For an introduction and guide to our concepts and theory, click here.
Here is a graph of the ratio of the gold price to the silver price. This shows how many ounces of silver one needs, to buy an ounce of gold. The ratio fell a bit this week.
The Ratio of the Gold Price to the Silver Price

For each metal, we will look at a graph of the basis and cobasis overlaid with the price of the dollar in terms of the respective metal. It will make it easier to provide terse commentary. The dollar will be represented in green, the basis in blue and cobasis in red.
Here is the gold graph. The February cobasis has risen a little.
The Gold Basis and Cobasis and the Dollar Price

The correlation between the gold cobasis and the price of the dollar continues this week. Last week, we observed that the "price hasn't moved much, but we can see its moves are driven leveraged speculators. Will they bid gold up to $1300 this week or sell it down to $1200? Maybe. They could."
Down to $1200 it was, not led by dishoarding but by selling futures. The price of gold went down and the cobasis of gold went up. We're now a week and $36 closer to the end of this trend. We also have a slightly increased scarcity in gold.
The trend could continue, or not. If you don't like the answer from your Ouja board, you might try Ask (8) Ball online. J
Now let's look at silver.
The Silver Basis and Cobasis and the Dollar Price

The silver price is down 26 cents, but the cobasis is not up. This ought to be concerning to silver bulls.
Last week, we said, "For the moment, we would not want to wager on silver one way or the other. If forced to take a position, we would be bearish."
We continue to see speculators cling to bullish views in silver, and our gut feeling is that the final capitulation has not yet occurred in silver. This does not mean the silver price can't bounce, but rather that we would not want to bet on it using either leverage or options with time decay.
We'll end this week with a question. Typically, the cobasis is close to a mirror image of the basis. At the moment the cobasis is bouncing around near flat while the basis continues in freefall. Thinking about the mechanics of the markets and how these two values are calculated, what could account for this? If there is interest, we'll answer next week.


