


Update 21st of January 2014


Arguments for lower prices:
- Overall Gold still is in a downtrend. US$1,525.00 remains the line in the sand. Gold will need much more time to break through this heavy resistance. Only a move above US$1,430.00 will indicate that the trend has changed.
- Gold Monthly Chart: MACD sell signal active since november 2011 (this is extremely powerful and needs to change before one can call the bottom, but MACD histogram is already turning higher from oversold levels...).
- Gold Daily Chart: Gold still trading below falling 200-MA (US$1,328.77). This alone defines a bear market.
- A daily close below US$1,180.00 would signal that the downtrend continues and could lead to the final stage of this multiyear correction targeting US$1,035.00 - US$980.00.
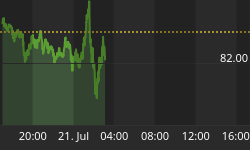
- The US-Dollar has been strengthening over the last couple of weeks and managed to move above 50-MA (80.70). At the same time the EURO has recently been weakening. A daily close below 1.3480US$ would signal that deflationary forces gaining power. Generally a stronger US-Dollar is not supportive for precious metals.
Arguments for higher prices:
- In the final days of december Gold managed to hold above the critical support level around US$1,180.00. From there it started to move higher during the first 3 weeks of January. This is very positive and supports the theory of a potential double bottom.
- Gold Weekly Chart: A new MACD buy signal is developing. The MACD histogram is moving into positive territory. At the same time the Slow Stochastic Oscillator is turning up from oversold levels.
- Gold Daily Chart: Gold cleared the 50-MA (US$1,241.91) and has been moving into next resistance zone around US$1,255.00 - US$1,275.00. We have a first small series of higher highs and higher lows. But the multi month downtrend line will be heavy resistance. So far the indicators supporting a continuation to the upside. The Slow Stochastic Oscillator is bullishly embedded with both signal lines above 80.
- Gold in EURO: The multi month downtrend line has already been broken. Historically most of the time EURO-Gold has been moving first.
- Gold CoT-Data: Commercial short position is still very low. The speculative funds at the same time have the lowest long position since 2005.
- Public Opinion & Sentiment: Sentiment for precious metal is rebounding from extremely oversold levels. For this week we can observe over 60% bulls which might lead to some form of short-term correction.
- Seasonality: The seasonal cycle remains very positive until mid of february for the precious metals sector.
- The US-Presidential Cycle is supportive for the next 12 months as the mid-term election years are traditionally good for Gold and Silver.
- Long term Fundamental: While the public is celebrating 100 years of Federal Reserve System, the balance sheet of the FED is now above US$4 trillion. The level has climbed by more than US$1 trillion over the course of 2013 as the central bank continued its bond-buying program launched in September 2012.
- US-budget & debt ceiling theatre will soon start again ....
Conclusion:
- More and more it looks like 2014 will witness a general trend change in the financial markets. While on a long term basis the precious metals sector is heavily oversold and should start a rebound, the stock market at the same time is very overbought, running into a multi year bearish wedge and should see at least a correction of 10-15% or more. The DowJones/Gold Ratio chart (13.3) is creating more and more negative divergences and might return to the long term downtrend in favor for gold. But so far there is no confirmation for this thesis. One could easily get caught up in this final phase...
- Gold has been able to hold above the critical support at US$1,180.00 and therefore chances are that the multiyear correction indeed is over and that the bottom building phase is coming to an end as well in the next coming months.
- After clearing the 50-MA (US$1,241.91), the 200-MA (US$1,328.77) will be activated as the next target. Therefore I think Gold will be able to at least recover towards US$1,300.00 until spring.
- My conclusion for traders: I don't see a straight move up in precious metals (although there is a lot of energy building in the daily silver chart with both bollinger bands moving sideways for quite some time already...). For Gold I'd expect more of a shaky up and down that will finally bring higher prices... Short-term we are seeing another dip below the 50-MA (US$1,241.91). This could go on for a couple of more days and might bring a buying opportunity as long as US$1,215.00-US$1,210.00 is not violated anymore.
- Investors with a long term perspective should continue to accumulate physical Gold and Silver while they are beaten down and trading below production cost.
Long term:
- Nothing has changed
- Precious Metals bull market continues and is moving step by step closer to the final parabolic phase (could start in summer 2014 & last for 2-3 years or maybe later)
- Price target DowJones/Gold Ratio ca. 1:1
- Price target Gold/Silver Ratio ca. 10:1
- Fundamentally, Gold should soon start the final 3rd phase of this long term bull market. 1st stage saw the miners closing their hedge books 2nd stage continuously presented us news about institutions and central banks buying or repatriating gold. The evolving 3rd and finally parabolic stage will end in the distribution to small inexperienced new investors who will be subject to blind greed and frenzied panic.


