


Why You Should Care About Black Monday
Since it happe32ned 26 years ago, many investors have lost perspective on the widespread financial damage that occurred on October 19, 1987. The S&P 500 dropped 20.47% on the day known as "Black Monday".

Bull Markets Are Typically Derailed By Recessions
The recent net-worth-denting bear markets were caused, for the most part, by problems in the economy that eventually translated into economic weakness. The dot-com bear market was accompanied by a contraction in the U.S. economy.

After the housing bubble began to lose air, the financial crisis bear market that followed was marked by some ugly GDP figures.

How About 1987?
The GDP figures in 1987 and 1988 did not align with the sharp drop in equity prices that occurred on Black Monday.

Markets Move Based On Fundamental Perceptions
There is a reason traders who focus on price/observable evidence are successful. Price captures the aggregate opinion of all market participants about future economic outcomes, earnings, valuations, systemic risk, monetary policy, the Fed, etc. In 1987, perception shifted quickly. Using a simple example from 2006-2008 to illustrate the concepts of using observable evidence, the slope of the green arrow below told us bullish economic conviction was stronger than bearish economic fear. The orange arrow told us the conviction of the bulls was waning, and to have defensive plans in place. The slope of the red arrow told us economic fear was much stronger than bullish economic conviction. The slopes of lines A, B, and C are observable and can be incorporated into an IF, THEN investment strategy.

1987: Were The Charts Helpful? You Decide
If broad measures of economic activity were not particularly helpful in spotting trouble in 1987, could charts/observable evidence have assisted investors in terms of reducing the damage to their net worth? This week's video examines 1987 in detail and compares the market profile the day before Black Monday to the current profile in January 2014. The video also incorporates IF, THEN concepts to build prudent investment allocations based on evidence in hand, rather than relying on predictions of a very uncertain future.
If you want another example of using observable evidence to navigate a difficult period, this video clip walks through the 2010 "Flash Crash" step by step.
2014: China Hampers Fundamental Outlook

As we outlined in this January 20 video, the big picture continues to align with the economic and stock market bulls, but bullish conviction is waning. Concerns about a credit crunch and/or defaults in China continue to weigh on investors' minds. China's central bank is trying to right the ship. From Bloomberg:
China's benchmark money-market rate fell while stocks rebounded as the central bank added more than 255 billion yuan ($42 billion) to the financial system and expanded a loan facility to meet Lunar New Year demand for cash.
As of 1:00 p.m. EST Tuesday, the injection of cash was not translating into renewed confidence; the emerging markets ETF (EEM) was down 0.40%, and the China ETF (FXI) was down 0.25%.
Investment Implications
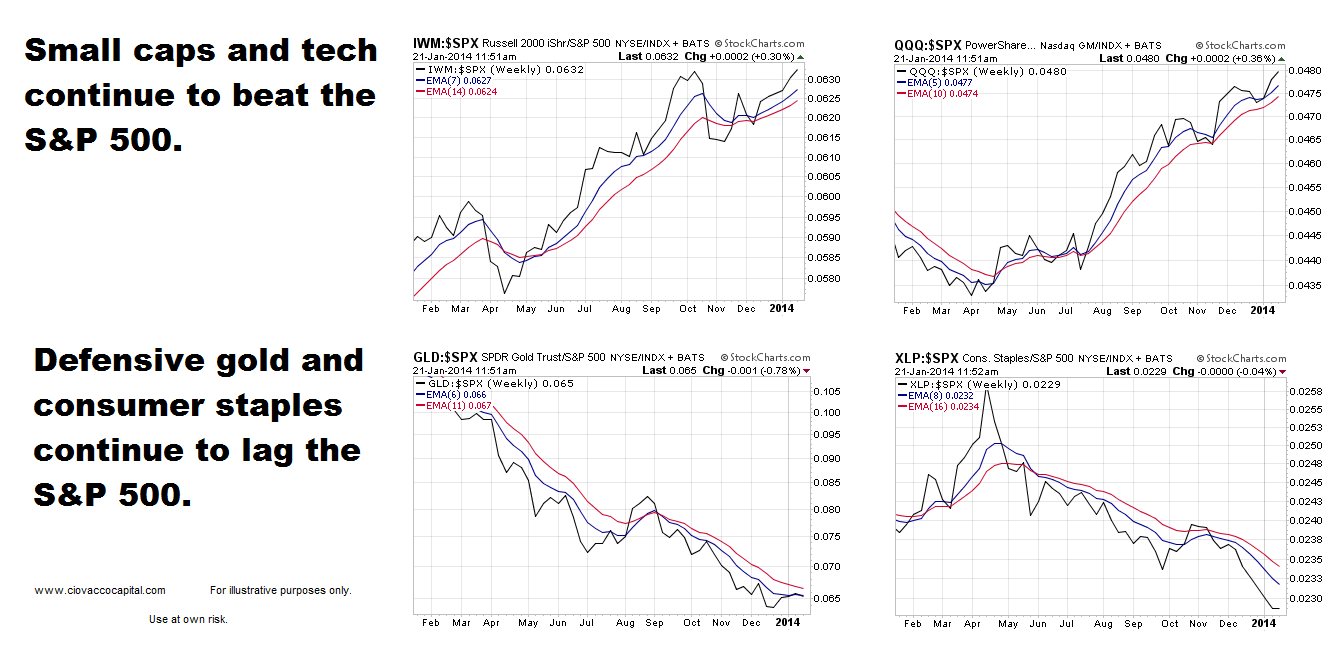
If defensive assets gain traction, our concerns about recent slowing bullish conviction will increase. During Tuesday's session, growth-oriented small caps were still providing leadership while defensive assets, such as consumer staples were lagging the broader S&P 500 (see charts). For now, the slowing bullish momentum has not translated into meaningful and observable changes to the market's risk-reward profile. The evidence continues to favor stocks. Consequently, we continue to maintain positions in U.S. stocks (VTI), financials (XLF), technology (QQQ), small caps (IJR), Europe (FEZ), and global stocks (VT).


