


2/18/2014 5:26:08 AM
Sunday was a key reversal date - here's what it means...
Good Holiday MondayMorning Traders,
While the markets are closed today, and the rally plays out, we had a key reversal date on the 16th. They're not normally this accurate, but we've seen a very high level of accuracy of late, so they're worth paying attention to. Could we be at a top? Here are a couple of points:

And a second one:

While these two indicators are toppy, let's go through our whole report before drawing conclusions...
As the week starts, we like to look at the economic calendar. Of note is the fed minutes - these can have an influence in the market direction.

If you do some intra day trading this is even more important as the release times, especially key reports, can represent intra day turning points.

Stock Barometer Analysis
Ignoring the barometer has cost us some returns, but we're moving towards a top here. This is expiration week, so that, combined with the barometer remaining in Buy Mode has me looking for prices to remain up near highs here.
The Stock Barometer is our proprietary market timing system. The direction, slope and level of the Stock Barometer determine our outlook. For example, if the barometer line is moving down, we are in Sell Mode. We'll target the next key reversal date for timing. A Buy or Sell Signal is triggered when the indicator clearly changes direction. Trend and support can override the barometer signals.
Money Management & Stops
To trade this system, there are a few things you need to know and address to control your risk:
-
This system targets intermediate term moves, of which even in the best years, there are usually only up to 7 profitable intermediate term moves. The rest of the year will be consolidating moves where this system will experience small losses and gains that offset each other.
-
This system will usually result in losing trades more than 50% of the time, even in our best years. The key is being positioned properly for longer term moves when they come.
-
Therefore it is vitally important that you apply some form of money management to protect your capital.
-
Trading a leveraged index fund will result in more risk, since you cannot set stops and you cannot get out intraday.
Accordingly;
- Make sure you set your stops so that you can lose no more than 2% per trade (based on the QQQ if you're trading leveraged funds and options with our trading service).
Potential Cycle Key Reversal Dates
2014 Potential Key Reversal Dates: 1/15, 1/21, 2/5, 2/16, 3/20... These dates have an accuracy of +/- 2 days. We publish dates up to 2 months in advance.
Our next key reversal date was Saturday 2/16. 2/5 played out as a low, so we were looking for a bounce into expirations (mid month) then a continuation of the move lower. I didn't expect such a large move in the markets, but there is a rush to buy into bottoms, which is a part of the reason for a potential top here. Next key reversal is 3/20, which would be a very bearish one month decline.
2013 Potential Key Reversal Dates: 1/16/13, 1/29, 2/14, 3/6, 3/15, 3/28, 4/5, 4/25, 5/13, 5/30, 7/19, 8/20, 8/29, 10/4, 11/3, 12/30. These dates have an accuracy of +/- 2 days. We publish dates up to 2 months in advance.
2012 Potential Reversal Dates: 1/12, 1/27, 2/16, 2/23, 3/16, 4/9, 4/25, 5/26. 6/2, 6/15, 7/2, 7/25, 8/13, 8/30, 9/8, 9/25, 10/7, 10/30, 11/15, 12/17, 1/15/13.
Our IRG Market Timing and Sentiment data service shows the performance of these forecast turn dates going back to 2003 and for the remainder of 2012. Our additional timing work is based on numerous cycles and has resulted in the above potential reversal dates. These are not to be confused with the barometer signals or cycle times. However, due to their past accuracy I post the dates here.
Timing Indicators
Use the following timing/momentum indicators to assist in your trading of the QQQ, GLD, USD, USO and TLT. They are tuned to deliver signals in line with the Stock Barometer and we use them only in determining our overall outlook for the market and for pinpointing market reversals. The level, direction, and position to the zero line are keys in these indicators. For example, direction determines mode and a buy signal 'above zero' is more bullish than a buy signal 'below zero'.
QQQ Timing Indicator (NASDAQ:QQQ)

The QQQ Spread Indicator will yield its own buy and sell signals that may be different from the Stock Barometer. It's meant to give us a big picture idea of the next turn in the market relative to the barometer signal.
Bonds Timing Indicator (AMEX:TLT)

Want to trade Bonds? Use our signals with Lehman's 20 year ETF AMEX:TLT. The direction of bonds has an impact on the stock market. Normally, as bonds go down, stocks will go up and as bonds go up, stocks will go down.
US Dollar Index Timing Indicator (INDEX:DXY)

Want to trade the US Dollar? Use our signals with the Power Shares AMEX:UUP: US Dollar Index Bullish Fund and AMEX:UDN: US Dollar Index Bearish Fund. The dollar direction can have an impact on the market and multinational companies - as the dollar goes up, it lowers the earnings for multinationals and can weaken the stock market and more so the Nasdaq.
Gold Timing Indicator (ARCX:GLD)

We're getting close to a signal on our commodity options services, so stay tuned...
Want to trade Gold? Use our signals with the Gold ETF AMEX:GLD. Gold gives us a general gage to the overall health of the US Economy and the markets.
OIL Timing Indicator (AMEX:USO)

Want to trade OIL? Use our signals with AMEX:USO, the OIL ETF. We look at the price of oil as its level and direction has an impact on the stock market.
Secondary Stock Market Timing Indicator

We maintain hundreds of popular and proprietary technical indicators that break down market internals, sentiment and money flow to give YOU unique insight into WHEN you should BUY or SELL the market. We feature at least one here in support of our current outlook.
As a subscriber to ANY Stock Barometer Newsletter, you also get access to all of Investment Research Group's charts and research on Market Timing.
Daily Stock Market Outlook
We remain in Sell Mode, as the market bounced to retest and in the case of the Qs, break highs. We expect a top to be in the making. But not everything is lined up for one.
First thing that suggests we are not at a top is the indicator above - the equity put call ratio. However, is some of the lack of change there because of the approaching expiration? Expiration can throw off sentiment since it is a calendar driven event. You want traders to take action as a result of their emotions, not a pre determined date.
On another point, while we expect that the market can lift here, I don't expect much more:

That being said, remember that the market can only go in 3 directions, and a liquidity driven trend higher can continue significantly longer than anyone expects. That can be fueled by bonds and that potential is there. That's my biggest concern from our vantage point.
I'm always in search of new data series to analyze. We don't look at monthly data because the ability to time off monthly data makes it useless as a timing indicator. Here is the weekly oil inventory data - inverse scale. You would expect there is an attempt to keep inventories stable. But you would expect inventories to build in a weak economy. And in a strong economy, you would expect inventories to be reduced. There almost appears to be a delay - as you would expect some lag in the influence of various instruments (as we use with some of our leading indicators).

Regards,
On a final note, we have a new stock trading service from David Cohne called Value Momentum Profits. He recommends a 5 position stock portfolio and manages the positions weekly. He also uses stocks under $10, because of their potential to explode higher unlike higher priced stocks. His target stock was up 14% last week. I'm working up a promo now to launch it to our clients and in that promo I'm going to give away a 52 page report on mathematically identifying bubble tops in financial markets. It's not something I would normally share because it is very heavy into math. But for anyone who signs on to try his service this week, I'll be sending a copy. It's an eye opener and it is very relevant to this market.
Here's a link to sign up with the $1 discount code.
Or visit www.stockbarometer.com - the sign up info is on the home page...
If you want to participate in a discussion of some of our indicators in Social Media, please visit and "LIKE" our FaceBook page. I'll have periodic updates on there and I WANT your feedback. This will be a good way to share your views with other traders.
http://www.facebook.com/InvestmentResearchGroupInc
Here's our current positioning.
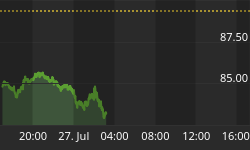
Last Recommendation - 1/24/14 Short QQQ at Open @ 88.06 (Previous trades - 12/12/13 - Short QQQ @ 85.24 - Stopped out 12/23/13 @ 87.41. 11/25 In cash. 11/8/ Short QQQ @ 82.54 closed at $84.29 on 11/25. 8/23 Long QQQ @ 76.73 closed on 11/8 @ 81.73, 8/16 Short QQQ @ 75.54 (closed on 8/23 at 76.63) 7/22/13 - Short QQQ @ 74.87 (stopped out) - 5/23/13 Short QQQ @ 72.95 (stopped out) - 3/5 Long QQQ @ 68.10, 5/23 closed at 72.95, 2/5 Short QQQ @ 67, 11/19 long at open at 62.97 closed 2/5 @ 67)
If you want to learn more about some of my models and indicators, we use my blog to cover them in more detail. If you're looking for more information, please visit our blog - We'll have updates and publish other articles there.
http://investmentresearchgroup.com/Blog/


