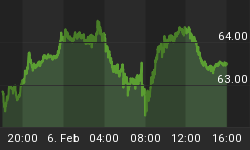
Maintain perspective! Skip the hope and hype, the "analysis" from vested interests, and look at facts:
- Silver closed on February 13, 2014 at $21.42.
- 50 days earlier, on December 26, 1913, it closed at $19.88
- That is about 7.7% price increase in 50 calendar days and about 11% above the December low. The silver bulls are celebrating. The silver bears are probably trying to convince themselves that a huge correction is imminent and perhaps silver will plunge to new lows.
- I personally heard Bo Polny announce on February 8 that gold and silver would have a good week. He was correct! Apparently he knew something that most of us did not.
- For some historical perspective, silver closed on April 9, 2013 at $27.88.
- 50 days later on May 29, 2013 it closed at $22.45, a loss of nearly 20%.
- Prices rise, prices fall. The same is true for housing, the Nasdaq, and Manhattan real estate.
So What? Look at history and facts and ignore the hype.
According to kitco.com, the average annual prices for gold and silver were:
| Year | Gold | Silver |
| 1913 | $20.64 | $0.58 |
| 1971 | $40.80 | $1.39 |
| 2013 | $1,411.00 | $23.79 |
Prices have dramatically increased for 100 years since 1913, the birth of the Federal Reserve - our inflation machine. Worse, since Nixon abandoned the partial gold backing for the dollar in 1971, the inflation machine has accelerated. Using Kitco's average annual price data:
-
Since 1913 gold has increased 4.32% per year, compounded annually. Silver has increased 3.78% compounded annually.
-
Since 1971 gold has increased 8.80% per year, compounded annually. Silver has increased 7.00% compounded annually.
-
Since 2001 gold has increased 14.74% per year, compounded annually. Silver has increased 15.17% compounded annually.
In the big picture, gold and silver are increasing in price, along with the prices for crude oil, an average house, gasoline, food, and almost everything we need. Both gold and silver have accelerated their average price increases since 2001, the end of their 20 year bear market.
Official national debt was $2.92 Billion in 1913 and nearly $17,000 Billion in 2013. The compounded annual increase since 1913 has been 9.04% while the increase since 1971 has been 9.31%. National debt increases, on average, quite consistently. Given that consistent exponential increase in national debt, are you surprised that the prices for gold, silver, crude, gasoline, food, and housing have also substantially increased, on average, every year?
The Big Picture
Silver gained 7.7% in 50 days. I think December marked a double bottom in the silver market, but we'll know in a few months. Crashes and large rallies are likely to happen more often in this era of High Frequency Trading and "managed" markets.
The national debt has been increasing, remarkably consistently, for 100 years, for 42 years, and for 6 years. Until monetary systems, administrative policy, and congressional spending practices change (return to fiscal sanity) the national debt, along with most other prices, will continue to increase.
We don't know if silver will continue its rally through next week or next month, but we can legitimately expect that silver prices, along with the national debt, will be substantially higher in 2015, 2016, and 2017!
Examine this graph of silver prices since 2000. Note the following:
- Log scaling
- Exponentially increasing prices
- The support line was touched in December 2013.
- There is a double bottom in June and December 2013.
- There is an expanding "megaphone" pattern of prices.
- Crazy and unlikely as it sounds, silver could spike to $100 in 2016 and not violate a 15 year "megaphone" pattern.
- MACD (monthly) buy signal in 2008, sell signal in 2011, and probable current buy signal.
So the next time you hear from an analyst that silver is likely to remain under $25 for the next decade or drop to $10, or whatever, remember 100 years of history, 100 years of price increases, and 100 years of official national debt exponentially increasing at 9% per year - compounded each and every year.
My belief is that 100 years of facts are much more relevant than opinions from various people who have a vested interest convincing people that silver and gold are dangerous investments. Examine silver cycles here: Silver: 4 Cycles in 12 Years.
And Clive Maund Analysis here: Silver Market Update


