

Arguments for lower prices:
- Overall Gold still is in a downtrend. US$1,525.00 remains the line in the sand. Gold will need much more time to break through this heavy resistance. Only a move above US$1,430.00 will indicate that the trend has indeed changed.
- Gold Monthly Chart: MACD sell signal active since november 2011 (this is extremely powerful and needs to change before one can call the bottom), but MACD histogram is already turning higher from oversold levels.
- Gold Weekly Chart: Last week a "doji star" appeared here and could signal a correction. Gold is facing massive resistance with the now rising weekly upper Bollinger Band (US$1,354.81).
- Gold Daily Chart: RSI turning down from overbought levels and MACD Histogram has been weakening in recent days.
- Gold CoT-Data: The latest data show that commercials have increased their net-short position dramatically over the last two weeks. They are now net-short 116,663 contracts on Gold-futures. At the same time speculative longs reached a 10 months high.
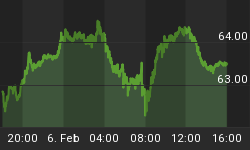
- Gold/Silver Ratio: Last friday the ratio closed at 62.48. Today Silver is not confirming Gold's new high for this bull move.
- Junior Gold Miners (GDXJ): MACD with a new sell signal. The embedded Slow Stochastic has been lost.
- Seasonality: During March the seasonal window typically is negative for Gold and Silver.
- Sentiment: According to sentimenttrader.com Gold has slightly moved into excessive optimism. Sentiment data for HUI Gold Bugs is at 90% and shows excessive optimism.
- Dr. Copper is under performing other commodity markets. Copper has lost around -6% while the CRB has gained 8%. The main reason is weaker demand from China.
Arguments for higher prices:
- Since end of december Gold has managed to establish a clear series of higher highs and higher lows. The critical support level around US$1,180.00 is far away and the price action continues to be strongly bullish.
- Gold Weekly Chart: Gold is breaking above the next downtrend-line. MACD buy signal is still active and supporting the bulls. RSI and Slow Stochastic Oscillator still have plenty of room to move higher.
- Gold Daily Chart: Gold is acting very strong and holding comfortably above the 200-MA (US$1,304.10). Despite a US$25.00 setback bears did not manage to push gold down. The bulls clearly remain in control. The "Slow Stochastic" Indicator is embedded.
- Huge geopolitical tensions in Ukraine could lead to a disaster. This crisis has the potential for the 3rd world-war. Let's hope that the political leaders will find a diplomatic solution.
- Short-term geopolitical and economic trouble in Asia may lead to rather higher than lower gold demand as Chinese would shift their wealth from a weakening yuan into gold. For example China's Gold imports via Hong Kong are up 300% for last january. One of last week's most important foreign exchange events was the sudden drop in the Chinese yuan.
- Prices for most of the food commodities have turned strongly higher during the last 2 months. This might fuel inflation in 2014.
Conclusion:
- During the last two weeks my preferred scenario 1 has more or less played out with Gold testing it's 200MA and bouncing back up towards US$1,345.00 followed by a sell off creating a short-term low last friday around US$1,320.00.
- But due to escalation in Ukraine Gold is strongly up this morning and it looks like it could move on towards US$1,430.00 without looking back anymore.
- The situation is really tricky as CoT, Seasonality, Sentiment and a couple of other indicators point towards lower prices until end or March.
- Thank God I have covered my shorts on Friday's low with a nice gain as I did not like the ongoing bullish undertone and the growing tensions in Ukraine. But should Gold move again below US$1,330.00 in the next couple of days I think a short-term top is established.
- If instead Gold manages to close above US$1,350.00 odds favor a continuation of the rally towards US$1,430.00. In the current market environment everything is possible and the probability for rising gold prices despite any technical setups is strongly increasing (safe haven buying..). As long as there is no peaceful diplomatic solution in the Ukraine but warmongers blaming each other I think Gold will move to US$1,430.00 rather fast.
- Traders should tighten up their stops to around US$1,319.00 on any long position and be very very careful here. The market should tell us soon if Gold indeed can continue to rally or if the initially expected correction below US$1,300.00 is going to take place.
- Investors with a long term perspective have to wait for a correction to buy physical Gold below US$1,290.00 and Silver below US$20,90. This is not the time to buy for the longer term but to be patient.
Long term:
- Nothing has changed
- Precious Metals bull market continues and is moving step by step closer to the final parabolic phase (could start in summer 2014 & last for 2-3 years or maybe later)
- Price target DowJones/Gold Ratio ca. 1:1
- Price target Gold/Silver Ratio ca. 10:1
- Fundamentally, Gold should soon start the final 3rd phase of this long term bull market. 1st stage saw the miners closing their hedge books 2nd stage continuously presented us news about institutions and central banks buying or repatriating gold. The evolving 3rd and finally parabolic stage will end in the distribution to small inexperienced new investors who will be subject to blind greed and frenzied panic.


