


QVM Clients, Rational Risk Subscribers and Friends,
We've had a couple of hard weeks in the US stock market. The S&P 500 is now 1.7% below its 2013 closing price (1816 versus 1848). That however, is not a reason to panic, nor a reason to be swept away by the excited announcers on Bloomberg TV and CNBC. They need ratings, but you don't need their emotion.
All of us as investors suffer to some degree from "recency bias" - interpreting the present with a heavy tilt toward expecting what we have recently experienced. We tend to expect great year in 2014 because 2013 was so good; and now that 2014 is not what we expected and is limping a bit, we revert back to our 2008-2009 nightmare and begin to fear terrible things. Certainly, there will be more terrible periods, and maybe soon, but so far we are still not at the point that data supports anything more than ordinary volatility (spiced of course recently and currently by geopolitical event in the Ukraine).
The US market could be bumping a ceiling. Profit margins are at historic highs and can't be relied upon to expand. P/E multiples on forward earnings are at the upper end of the normal range. Profit growth expectations are high. The stock market-cap as a percentage of GDP is at an all time high. There seems to be a frothy social media IPO market.
Those are all negatives, but it isn't over 'til the fat lady sings, and she isn't singing so far.
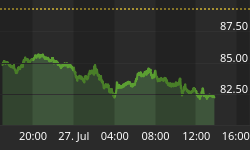
This chart of the S&P 500 weekly since the peak in 2007 illustrates that we are still on an upward path, although in one of its nervous pockets:

Different sectors are behaving differently, and some air has been let out of some sectors or industries that were perhaps over subscribed. Biotech, for example, has come in a lot. We had exposures there, but closed them out about a week or so ago.
The utility sector is by far and away the strongest sector right now in terms of the percent of stocks in bullish patterns and with prices above their 200-day and 50-day averages. The other two of the top three sectors are consumer staples and energy. Utilities and staples are clear defensive sectors (which on a valuation multiple basis are expensive), but are go-to places when rotation from aggressive to defensive takes place. Energy is not generally defensive, but the Ukraine/Russia situation is probably helping prices there a bit.
The weakest sector is by far and away consumer cyclicals, which typically suffers when there is a shift to defense. Industrials and healthcare round out the bottom 3 sectors in terms of chart conditions at this time.
Emerging markets, which have been weak for a long time (but with very low P/E multiples relative to the developed markets) have been outperforming the S&P 500 very recently. Both are still taking in money, but the inflows to emerging market funds relative to their size is currently greater than for large-cap US stock funds. For example, in the past month SPY (the largest ETF by assets which tracks the S&P 500) added 2.6% to its total assets, whereas EEM (the large emerging markets ETF added 12.3%). That difference in net flows has a lot to do with relative price changes.
Speaking of relative price changes, let's take a quick look at 6 different pairs of indexes to see how defensive versus aggressive assets are doing.
In each of the following charts, there are two panels. The bottom panel in black plots the defensive index in the pair. The top panel in red plots the ratio of the price of the defensive index divided by price of its aggressive counterpart - the ratio of price levels of somewhat opposite indexes.
When the red line is rising, the defensive index is doing better than the aggressive index, and when the red line is falling, the aggressive index is doing better.
The first thing you might think of would be Value stocks versus Growth stocks - so here that is. Value is plotted below in black, and the ratio of the price of Value divided by Growth is plotted in red above. Growth was winning in the second half of 2013, and Value is winning now.

How about High Quality versus Low Quality? Same story. Low Quality stocks were leading in the second half of 2013, but now High Quality is leading.

Low volatility and High Beta (basically high volatility) is less dramatic, but the winning ways of High Beta are moderating and Low Volatility is nudging ahead now.

Dividends were falling out of favor in the second half of 2013 relative to the overall market, but that has changed recently too; as this chart of the S&P 500 Dividend Aristocrats versus the overall S&P 500 index shows:

Mega-cap versus small-cap is another classic defensive versus aggressive pair. This chart plots to S&P 100 (mega-cap) versus the Russell 2000 (small-cap). Mega-cap began a struggle with small-cap in the 4thquarter of 2013, and is leading in 2014 - a preference for defensive versus aggressive stocks.

The giant US market versus emerging markets it widely appreciated as a defensive versus aggressive choice - but maybe not right now. The ratio of the S&P 500 divided by the MSCI Emerging markets index, shows defensive US winning until just recently, when emerging markets pulled ahead on relative price changes. Major differences in valuation may have something to do with that - not entirely sure. We don't have any emerging markets exposure at the moment.

That's how key defensive versus aggressive stock indexes stack up right now.
This week should shed a great deal more light on the matter with both earnings reports coming out and the Ukraine situation coming to a head; and maybe even a European Central Bank decision to lower interest rates there.


