• 989 days Will The ECB Continue To Hike Rates?
  • 989 days Forbes: Aramco Remains Largest Company In The Middle East
  • 991 days Caltech Scientists Succesfully Beam Back Solar Power From Space
  • 1,390 days Could Crypto Overtake Traditional Investment?
  • 1,395 days Americans Still Quitting Jobs At Record Pace
  • 1,397 days FinTech Startups Tapping VC Money for ‘Immigrant Banking’
  • 1,400 days Is The Dollar Too Strong?
  • 1,400 days Big Tech Disappoints Investors on Earnings Calls
  • 1,401 days Fear And Celebration On Twitter as Musk Takes The Reins
  • 1,403 days China Is Quietly Trying To Distance Itself From Russia
  • 1,403 days Tech and Internet Giants’ Earnings In Focus After Netflix’s Stinker
  • 1,407 days Crypto Investors Won Big In 2021
  • 1,408 days The ‘Metaverse’ Economy Could be Worth $13 Trillion By 2030
  • 1,408 days Food Prices Are Skyrocketing As Putin’s War Persists
  • 1,411 days Pentagon Resignations Illustrate Our ‘Commercial’ Defense Dilemma
  • 1,411 days US Banks Shrug off Nearly $15 Billion In Russian Write-Offs
  • 1,414 days Cannabis Stocks in Holding Pattern Despite Positive Momentum
  • 1,415 days Is Musk A Bastion Of Free Speech Or Will His Absolutist Stance Backfire?
  • 1,415 days Two ETFs That Could Hedge Against Extreme Market Volatility
  • 1,417 days Are NFTs About To Take Over Gaming?
The Problem With Modern Monetary Theory

The Problem With Modern Monetary Theory

Modern monetary theory has been…

Zombie Foreclosures On The Rise In The U.S.

Zombie Foreclosures On The Rise In The U.S.

During the quarter there were…

Stock Barometer

Stock Barometer

Stock Barometer

Stock Barometer is completely independent. We have never and will not ever accept compensation from any company whose stock we recommend. Our goal is to…

Contact Author

  1. Home
  2. Markets
  3. Other

Signs of Trouble?

5/1/2014 5:52:44 AM

Good morning Traders,

As the markets hang up near highs, let's look at a bullish sign:

NASDAQ Yearly New Highs Chart

Unless the market is going to enter a much deeper bearish environment, we would expect this indicator to bounce back up towards highs.

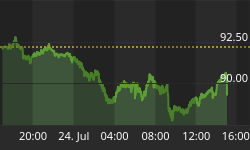
I also wanted to follow up on our oil discussion yesterday. We are in USO PUTS in our Oil Options Trader, here is one of our indicators:

Oil Inventories versus Oil Chart

This building of oil inventories can be a bearish sign for the price. And oil as a trading vehicle can really trend. So we could see oil head lower for a while once prices start to break.

Timing wise:

Oil Timing Indicator Chart

In the short term, oil is getting extended, but that is how most longer term sell offs start. So we will see how this plays out.

Regards,


Back to homepage

Leave a comment

Leave a comment