Gold kicked off the week at just over $1300 before declining to a low of $1278 yesterday. Most of the time prices just moved sideways, drifting lower from time to time to test support. And when support materialised, the price quickly reacted upwards, because no bullion bank really wants to sell; instead they are trying to close short positions as profitably as possible.
Underlying physical supply is very tight, and GOFO ("The Gold Forward Offered Rate") in London has now been negative every day since 3rd April 2014. Chinese demand measured through Shanghai Gold Exchange deliveries appears to have slackened after a very strong start to the New Year. However, it is not clear whether it is because of lower demand, or alternatively a reluctance among the large Chinese banks to bid up for physical in London. I suspect the latter may be the case, because the Chinese have always bought gold when bullion is available and have never chased the price up.
While on the subject of China, the IMF ("International Monetary Fund") announced this week that on a purchasing power basis China is overtaking the US as the largest economy. Her latent power to purchase more precious metals is now far greater than for any single other nation, given a savings rate in excess of 40%; so any concerns about her dwindling demand are essentially short-term.
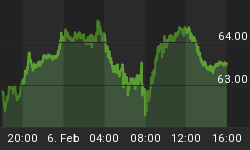
Meanwhile silver has been very weak, as can be seen in the introductory chart, giving up all this year's gains and taking the gold/silver ratio to an exceptionally high 67 times. Interestingly, it appears that silver bullion has been disappearing from the markets at an extraordinary rate <http://www.silverdoctors.com/the-decline-in-shanghai-silver-stocks-picks-up-speed/> , with stocks at the Shanghai Futures Exchange falling from 1,123 tonnes a year ago to 258 tonnes today. Comex stocks have also declined by 218 tonnes since the end of February. Nobody seems to know why this is so, but the most likely explanation is that industrial users are stockpiling the metal as inventory at these ultra-low prices. It is also possible the Chinese government is adding silver to its own strategic reserves.
The broader market background to precious metals is extremely unusual. The Federal Open Market Committee ("FOMC") statement was accompanied by the biggest GDP miss in a long time: first quarter GDP consensus was forecast to have slowed to 1.2% annualised, but actually came in at only 0.1%. Furthermore, it is becoming clear that subsequent revisions, particularly from disappointing construction orders in March, will take the GDP number firmly into negative territory. Yet the FOMC stated "Information received since the Federal Open Market Committee met in March indicates that growth in economic activity has picked up recently......"
While the Fed is whistling to keep its spirits up low, US Treasury yields are signalling a financial system awash with liquidity and a reluctance to invest in production. The ten-year Treasury bond yields only 2.63%, and even more extraordinary, Spanish 10-yr sovereigns are at 2.99%, Italian 3.05% and Ireland's only 2.81%. Bearing in mind that government indebtedness everywhere has escalated at the fastest rate in history excluding during major war, there should be a substantial risk premium for this debt.
The logical explanation for a flight into financial assets and cash can only be a stalling US economy. Corporates are very active in bond markets, but they are only refinancing existing debt.
It really feels like the money bubble is poised on the edge of an economic chasm. Not falling into it involves throwing yet more money at the problem, which will eventually persuade western investors to buy gold and silver.
Next week's announcements
Monday. Eurozone: Sentix Indicator, PPI. US: ISM Non-Manufacturing Index.
Tuesday. Eurozone: Composite PMI, Services PMI, Retail Trade. US: Trade Balance, IBD Consumer Optimism. Japan: BoJ releases minutes.
Wednesday. US: Non-Farm Productivity (prelim.) Unit Labour Costs (prelim.), Consumer Credit. br /> Thursday. UK: BoE Base Rate. Eurozone: ECB Deposit Rate. US: Initial Claims
Friday. Japan: Leading Indicator. UK: Industrial Production, Manufacturing Production, Trade Balance. NIESR GDP Estimate. US: Wholesale Inventories.


