• 309 days Will The ECB Continue To Hike Rates?
  • 310 days Forbes: Aramco Remains Largest Company In The Middle East
  • 311 days Caltech Scientists Succesfully Beam Back Solar Power From Space
  • 711 days Could Crypto Overtake Traditional Investment?
  • 716 days Americans Still Quitting Jobs At Record Pace
  • 718 days FinTech Startups Tapping VC Money for ‘Immigrant Banking’
  • 721 days Is The Dollar Too Strong?
  • 721 days Big Tech Disappoints Investors on Earnings Calls
  • 722 days Fear And Celebration On Twitter as Musk Takes The Reins
  • 724 days China Is Quietly Trying To Distance Itself From Russia
  • 724 days Tech and Internet Giants’ Earnings In Focus After Netflix’s Stinker
  • 728 days Crypto Investors Won Big In 2021
  • 728 days The ‘Metaverse’ Economy Could be Worth $13 Trillion By 2030
  • 729 days Food Prices Are Skyrocketing As Putin’s War Persists
  • 731 days Pentagon Resignations Illustrate Our ‘Commercial’ Defense Dilemma
  • 732 days US Banks Shrug off Nearly $15 Billion In Russian Write-Offs
  • 735 days Cannabis Stocks in Holding Pattern Despite Positive Momentum
  • 736 days Is Musk A Bastion Of Free Speech Or Will His Absolutist Stance Backfire?
  • 736 days Two ETFs That Could Hedge Against Extreme Market Volatility
  • 738 days Are NFTs About To Take Over Gaming?
Strong U.S. Dollar Weighs On Blue Chip Earnings

Strong U.S. Dollar Weighs On Blue Chip Earnings

Earnings season is well underway,…

What's Behind The Global EV Sales Slowdown?

What's Behind The Global EV Sales Slowdown?

An economic slowdown in many…

The Problem With Modern Monetary Theory

The Problem With Modern Monetary Theory

Modern monetary theory has been…

Stock Barometer

Stock Barometer

Stock Barometer

Stock Barometer is completely independent. We have never and will not ever accept compensation from any company whose stock we recommend. Our goal is to…

Contact Author

  1. Home
  2. Markets
  3. Other

Money Flow Friday

5/2/2014 6:23:55 AM

Good morning Traders,

As we update money flow numbers in our data base every Friday, we see a bonds being critical to the next move in the market.

It's all the talk. The divergence between the nyse and the nasdaq where the more nyse oriented indices (DIA, SPY) are at near highs and the more Nasdaq oriented indices (qqq, rut) are showing more damage. These situations tend to always resolve - but the question is which direction - which index is right? And I believe bonds hold the key.

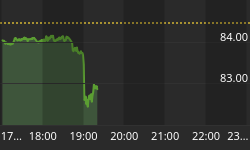
First, let's take a look at a simple momentum indicator on TLT price action:

Bond Timing Indicator Chart

This gradually lifting price action is bullish for bonds (bearish for stocks). So with bonds going up, you would think that money is flowing INTO bonds:

Taxable Bond Fund Money Flows

Money flow tends to be a contrarian indicator. So money is actually flowing out of bonds and usually when it reaches a peak, you're at a reversal. So bonds could go higher.

That's causing some concern and some hedging in the vix market:

VIX Put/Call Ratio and Open Interest Chart

Traders are loading up on vix puts, which drives this indicator lower. The funny thing is, when they do that, it tends to push the market higher.

And finally, the barometer:

Daily Stock Barometer Primary System Chart

That head and shoulder's pattern (absent the volume) looks ominous. But the energy exists for the market to rally here. And the barometer is technically in buy mode, which suggests that we'll see higher prices, contrary to the big bet in the VIX. And quite possibly meaning we'll see a market advance into July - which is the peak in one of our timing models (in our research indicators that are updated every weekend).

So today's wild card is the jobs report. And it's a Friday. So unless the report comes out at some extreme level, I believe we will see an advance into next week where we could possibly see a top - as we're approaching a key reversal date next week and we have a bit of bets on fear to work out of the system.

Regards,


Back to homepage

Leave a comment

Leave a comment