• 742 days Will The ECB Continue To Hike Rates?
  • 742 days Forbes: Aramco Remains Largest Company In The Middle East
  • 744 days Caltech Scientists Succesfully Beam Back Solar Power From Space
  • 1,144 days Could Crypto Overtake Traditional Investment?
  • 1,149 days Americans Still Quitting Jobs At Record Pace
  • 1,150 days FinTech Startups Tapping VC Money for ‘Immigrant Banking’
  • 1,154 days Is The Dollar Too Strong?
  • 1,154 days Big Tech Disappoints Investors on Earnings Calls
  • 1,155 days Fear And Celebration On Twitter as Musk Takes The Reins
  • 1,156 days China Is Quietly Trying To Distance Itself From Russia
  • 1,157 days Tech and Internet Giants’ Earnings In Focus After Netflix’s Stinker
  • 1,161 days Crypto Investors Won Big In 2021
  • 1,161 days The ‘Metaverse’ Economy Could be Worth $13 Trillion By 2030
  • 1,162 days Food Prices Are Skyrocketing As Putin’s War Persists
  • 1,164 days Pentagon Resignations Illustrate Our ‘Commercial’ Defense Dilemma
  • 1,165 days US Banks Shrug off Nearly $15 Billion In Russian Write-Offs
  • 1,168 days Cannabis Stocks in Holding Pattern Despite Positive Momentum
  • 1,169 days Is Musk A Bastion Of Free Speech Or Will His Absolutist Stance Backfire?
  • 1,169 days Two ETFs That Could Hedge Against Extreme Market Volatility
  • 1,171 days Are NFTs About To Take Over Gaming?
Stock Barometer

Stock Barometer

Stock Barometer

Stock Barometer is completely independent. We have never and will not ever accept compensation from any company whose stock we recommend. Our goal is to…

Contact Author

  1. Home
  2. Markets
  3. Other

The End of The World as We Know It

5/8/2014 5:39:50 AM

Good morning Traders,

The divergence in the NYSE and Nasdaq continues. We are looking for a resolution. But what is the timing? Here is our cycles and basic seasonality chart for your reference:

10/20/40 Week Cycles and Seasonality Chart

Another interesting peak reading we are seeing from one of our indicators:

AAII % Neutral Chart

This 'neutral' reading is robbing from bullish and bearish readings - but at the end of the day, a reading this high is generally bearish.

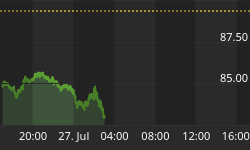
Switching to oil real quick, since we are watching for a potential sell off:

US Oil Inventories versus Oil Chart

And finally, the barometer:

Daily Stock Barometer Primary System Chart

I tend to fight the obvious when it comes to technicals because if everyone can see it, what good is it. So while we may see a move towards lows at some point, I am not so sure this pattern will play out - though the potential exists. Our model is suggesting the potential exists and we will continue to position for a next larger move, which is this case should be lower.

Regards,


Back to homepage

Leave a comment

Leave a comment