


Dear Subscribers and Readers,
We switched from a 50% long position to a completely neutral position in our DJIA Timing System on the morning of June 13th at DJIA 10,485. The short-term trend for the foreseeable future still remains down - and most of our technical indicators are still too overbought to sustain a decent rally (should one occur) going forward. I am still looking for a "blow off" rally to occur later this year, but this can only occur after the market has experienced a significant correction. For now, nimble (retail) traders should stay in cash and use this "down time" to research potential long ideas instead of trying to outwit the very short-term movements of the stock market. Remember: Over the long-run and for the majority of investors, the big money is usually made on the long side.
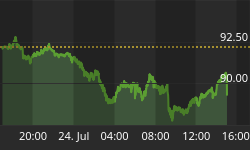
Last week, I asked our readers to read Mr. John Mauldin's latest take on the subject entitled: "The Idea of Europe" - which acts as a great starting point for understanding the issues that Europeans and our globalized economy are facing today. The fact that the Euro performed very poorly over the last few trading days - despite it being at a natural support level - tells me that the Euro should continue to underperform going forward. Since the beginning of this year, I have always emphasized that the U.S. Dollar is all set to rally in 2005 - even to the extent of devoting nearly an entire commentary to it on May 1, 2005 ("The U.S. Dollar is Going Up"). At the time of the May 1st commentary, the U.S. Dollar Index was trading at the 84 level - today, it is over 90 - and I believe we still have more room to go on the upside over the next 12 to 18 months.
Let's start off with a discussion of the U.S. Dollar Index. The most recent U.S. Dollar bottom was accompanied by the March 21st article of the U.S. Dollar from Newsweek - one of the best contrarian indicators in the mainstream media (besides the Time Magazine). It has only been three months since the publication of that article, and most Americans today are still relatively bearish on the U.S. Dollar - citing the current account deficit as the main reason for a declining dollar going forward (as an aside, I am still seeing a significant number of online ads from foreign exchange brokers touting the fact that retail investors can buy 500,000 Euros for as little as US$5,000, etc.). While it feels comfortable to adopt the views of our peers or the mainstream media, it is almost always not a profitable exercise to do so. Here at MarketThoughts, we have always tried to look very far out ahead, and this is one of the instances where we have (since the beginning of this year) and has been richly rewarded for it. While mainstream investors are still worried about the "declining dollar," we are revising our upside target from a range of 92 - 97 to a range of 95 - 100 for the foreseeable future. I will now attempt to explain why.
One of the major factors on why we are (still) bullish on the U.S. Dollar Index in the foreseeable future is the trend of the Federal Funds rate - along with the fact that the Federal Reserve has not signaled an intent to stop those rate hikes for the foreseeable future. Interestingly, the action of the Fed Funds rate has more or less led the U.S. Dollar Index by 18 to 20 months over the last 20 years. The most recent rate hikes suggest that the rising trend of the U.S. Dollar Index should continue for the next 12 to 18 months - at least until we approach the 95 to 100 level.

Our bullish views on the U.S. Dollar Index is made the more authoritative by the fact that European countries such as Sweden and Poland have either cut or are beginning to further cut their short-term rates. In fact, there is now widespread speculation that the European Central Bank will cut by 50 basis points by the end of this year. The United Kingdom is also probably not far behind. It is usually rare for the U.S. Central Bank to lag the action of the majority of the world's Central Banks, but until the Fed reverses course and start to cut rates, our bullish view will remain intact - although we will continue to monitor this situation for our readers going forward. There is, however, a very important corollary to all this: It now looks like the $US carry trade is about over - and that there is a good chance that this will be replaced by the Euro carry trade. If this is indeed the case, then our target of parity for the Euro may actually be breached on the downside during the next two to three years.
I now want to discuss a more complex analysis on why we continue to be bullish on the U.S. Dollar Index for the foreseeable future. This is basically an update of one of our analyses in our May 1st commentary:
Studies by GaveKal (which is one of the best investment advisory outfits out there) have shown that, historically, the return of the U.S. Dollar Index has been very much correlated with the growth in the amount of foreign assets (which is pretty much all U.S. dollar-denominated) held in the custody of the Federal Reserve. By my calculations, the correlation between the annual return of the U.S. Dollar Index and the annual growth of the amount of foreign assets held at the Federal Reserve banks (calculated monthly) is an astounding negative 61% during the period January 1981 to February 2005! That is, whenever, the rate of growth of foreign assets (primarily in the form of Treasury Securities) held at the Federal Reserve banks have decreased, the U.S. Dollar has almost always rallied.
If one thinks about it carefully, this makes logical sense. The decrease of foreign reserves at Federal Banks means that either foreigners are demanding more U.S. dollars or that the supply of U.S. dollars is shrinking (or both), which in turn should increase the value of the U.S. dollar relative to most major currencies, such as the Euro, the Yen, the British Pound, and the Korean Won. Following is a monthly chart showing the historical relationship between the annual change in the U.S. Dollar Index vs. the annual rate of growth in foreign reserves (second derivative). This is updated to the end of June for the former and end of April for the latter. I will provide a more updated analysis in next weekend's commentary - after the May 2005 data for foreign reserves has been released. Please note the historical inverse relationship between these two indicators:

More recently, there has been a divergence - in that the U.S. Dollar Index has not been increasing as much as it should have given the historical relationship. My educated guess is that they will converge in due time - especially given the continuing hike of the Fed Funds rate and the still-prevailing bearish sentiment among the mainstream media and retail investors alike. Like we have mentioned before, our ultimate upside target range for the U.S. Dollar Index has now been revised from 92 - 97 to 95 - 100. Again, I will provide a further update once the May 2005 data for foreign reserves has been released - most probably in next weekend's commentary.
While I will not show the chart here until next weekend, please note that a financial or economic crisis has usually occurred whenever we have experienced a year-over-year decrease in foreign reserves. For the month ending April 2005, the growth in foreign reserves is still at a very respectable 11.3%, but if the trend of the past six months continues, then the growth of foreign reserves can very well stagnate in about six months time - either producing an economic crisis somewhere in the emerging markets or even a global economic slowdown. I will provide an update in next weekend's commentary (assuming that the latest data has been released by that time) but for now, let's just stay that the slowdown in money supply growth in the U.S. and Japan (which we showed you in our commentary from two weeks ago) is confirming that idea. Please also note that as the U.S. dollar continues to rise in the months ahead, China will also need to put a brake on money supply growth - thus further exuberating the current decline in liquidity. This is a major downside for having a pegged currency.
Ironically, the only major area in the world which has been experiencing decent money growth has been the Euro Zone - which consists of Austria, Belgium, Finland, France, Germany, Greece, Ireland, Italy, Luxembourg, Netherlands, Portugal, and Spain. Following is monthly chart showing the year-over-year growth in M-3 of the Euro-Zone from January 1980 to May 2005:

As Germany is set to implement reforms starting as early as next year, there is a good chance some of these countries may actually start to outperform and help "kick start" worldwide economic growth - despite the fact that a significant amount of liquidity is currently "consumed" by the social state and by high energy prices. The wildcard is whether the European Central Bank will be willing to lower its short-term rates as the Euro continues its descent against the U.S. dollar and against almost nearly every major currency? If not, then money supply growth in the Euro Zone can potentially collapse as investors "reallocate" their funds from Europe to either the United States or to Asia.
As far as the impact on the U.S. stock market, I believe the continual of a U.S. dollar rally going forward should generally help U.S. equities - as both institutional and pension fund managers are currently overweight both Europe and Asia and underweight U.S. equities. That is, I expect U.S. equities to outperform the various world benchmarks over the next 12 to 18 months - although in the short-term, anything goes as the Fed continues to hike the Fed funds rate and as money growth in the U.S. continues to be dismal (the $5.9 billion increase in seasonally-adjusted M-3 for the week ending June 27th isn't exactly anything to write home about). Keep in mind, however, that this is purely an educated guess on my part since there really has not been a very good direct relationship between the performance of the U.S. dollar and the performance of the U.S. stock market.
Disregarding the potential impact of the U.S. dollar, I still believe the beginning of my "blow off scenario" should materialize over the next two to four months, but whether this "blow off" will last three months or three years is anybody's guess. For now, let's just say that both the cyclical bull market cycle and the corporate profit cycle is maturing. This is very important, as "blow off" tops usually occur towards the end of bull market as it kills the shorts and sucks in most retail investors on the long side before exhausting and collapsing on itself. Following is a chart showing the growth of quarterly profits in the U.S. vs. quarterly profits as a percentage of GDP from the 1Q 1980 to 1Q 2005:

Please note that corporate profits as a percentage of GDP has now surpassed the 3rd quarter 1997 high of 9.3% - and is now at a high not see since the first quarter of 1969. Also note that this current percentage is now nearly 2.4 percentage points above the 25-year average of 7.06%. Of course, the concept of outsourcing and "offshoring" has greatly contributed to these profits - as the world excess pool of educated and semi-skilled workers are soaked up by the various public companies here in the United States, in Europe, and in Japan. These two factors have also worked together to keep wages relatively low in the U.S. The question is: How much further can this go on? Reports over the last two years and particularly over the last six months are signaling that the labor markets in both China and India are being exhausted - although there is now talk that China is planning to "open up" its inner and Western regions for development. Moreover, while manufacturing plants can be relocated from China to, say, Vietnam if wage inflation really gets out of hand in the former - the same cannot be said for positions that have relatively high educational requirements, such as research or positions in call centers. My guess is that the outsourcing or "offshoring" in the latter is definitely overstated in the short-run, and thus Western companies may actually find themselves struggling to hire more workers in these fields going forward. A huge downside of laying off workers (barring a fiscal crisis that could bring down the company) is the huge loss of credibility. Who would work for a company that has historically, consistently work their employees to extremes and who then lay them off when the company misses one quarter of earnings estimates?
Note that this abnormally high profit margin is now coming home to roost - as earnings growth of the S&P 500 companies is expected to be under double digits - for the first time in 12 straight quarters.
Another pillar of support for the "blow off" scenario is the huge amount of short interest outstanding on both the NYSE and the NASDAQ. While a huge short interest does not necessarily mean that the stock market will rally in the next two to three months, it does mean that there is a huge potential for the market to rally further as the shorts are forced to cover in a major stock market rally. Instead of showing you the absolute amount of short interest outstanding on the NYSE, I will show you the weekly chart of the NYSE Short Interest Ratio vs. the Dow Jones Industrials from January 1994 to the present:

Please note that the market (as measured by the Dow Industrials) has shown a propensity to rally whenever the NYSE Short Interest Ratio has spiked up - with the most recent examples being October 2002 and October 2004 (with a spike to a short interest ratio of 6.7 in both cases). The current spike reading is 6.2. While this reading is high relative to the average, my guess is that this is still not high enough - especially given the overbought conditions I am still currently seeing in the majority of my technical indicators. Again, I will need to see a more significant correction here (which would hopefully further increase short interest) before I would like to call for a more sustainable rally going forward.
This begs the question: Why are investors and fund managers so cautious? Perhaps it's a sign of the slowing global economy, or the potential bursting of the "housing bubble" - but one thing I can say is that cyclical bull markets don't end with such cautiousness. Sure, this cyclical bull market is maturing and sure, all these negative scenarios may come to fruition, but bull markets always end in a blow off scenario and that is why I am currently looking for one. Even if we do not get one, chances are that there will be a very significant rally beginning in the next two to four months. Such a scenario is also supported by the eight-week moving average of the NYSE Specialist Short Ratio:

Please note that the eight-week moving average of the NYSE Specialist Short Ratio just hit an all-time low of 17.68% two weeks ago - which should have hugely bullish implications once our other technical indicators are oversold enough to set in place the necessary conditions for a major stock market rally. Readers who are not familiar with the NYSE Specialist Short Ratio should go back and read our May 15, 2005 commentary on the subject.
During the next couple of months, I intend to focus more of my time and effort into finding individual stocks that should potentially do well in this final "blow off phase." Of course, this should not be construed as official investment advice, so please do your own research before initiating any long or short positions! That being said, I will try to outline some of those stocks here (and to get feedback from you, our readers) in this commentary and in our discussion forum in the weeks ahead. Now, let's go ahead and discuss the most recent action in the stock market - using the daily action of the Dow Industrials vs. the Dow Transports as our basis:

The violent breakdown of both the major Dow Indices in the final two trading days during the week before last is still very worrying to me - as the most recent bounce in these two indices and in the market should merely be construed as just that - a mere bounce. My most educated guess for this week is to for us to remain in a trading range with a slight upward bias - as investors wait for the release of the latest quarterly earnings report and as the number primary and secondary offerings as well as the amount of insider selling is expected to slow down significantly this week. On a side note, I want all my subscribers to forget about initiating long positions in the next several weeks, as earnings announcement will be in full swing during that time. Please keep in mind that the companies in the S&P 500 index is expected to report earnings growth (as a whole) to be under double digits for the first time in 12 straight quarters. My guess is that the risk is now biased towards the downside - especially in the transportation and the financial sectors.
Now, for our technical and sentiment indicators. The 10-day NYSE ARMS Index is now at 1.19 - a decently oversold level but not enough to sustain a major bull rally. Conversely, the 10-day moving average of the equity put-call ratio is still at 0.56, while the NYSE and the NASDAQ Summation Index are also at very overbought levels. Moreover, the percentage of stocks on the NYSE that are above their 20-day EMAs is still at a high level of 67.67%. The author would like to see this percentage touch 20% or lower before I would consider going long in our DJIA Timing System or in any individual stocks.
The lack of an oversold condition is also reflected in many of our surveys - including the following chart showing the Bulls-Bears% Differential in the American Association of Individual Investors Survey:

Even though the Bulls-Bears% Differential in the AAII survey tanked from 29% to 16% in the latest week, this survey is still at a relatively overbought level. I definitely would not advocate initiating any long positions here until we see a more oversold condition in this survey. However, readers should keep in mind that the most drastic of declines in the stock market have occurred while this survey is oversold.
Interestingly (and more bearishly), the Bulls-Bears% Differential actually rose slightly last week - from an already overbought reading of 33.7% to a still more overbought reading of 36.0% - suggesting that the market most probably has more downside room to go:

Again, based on readings from the Investors Intelligence Survey, we will not initiate any long positions here until we start seeing more oversold readings - such as readings in the 10% to 15% range. For now, we will just sit and wait and use our "spare time" to do research on potential long positions once this correction has played itself out.
By far, the most "accurate" indicators out of our three popular sentiment indicators has been the Market Vane's Bullish Consensus readings - in that this reading never really got that oversold during the last 18 months - which, in retrospect, correctly indicated that any rally over the last 18 months would be relatively dismal:

Over the last week, the Market Vane's Bullish Consensus "sold off" slightly to 67% - but still a very overbought reading. Given the readings of our two other sentiment indicators (as of the Consumer Confidence Index as I will discuss in the following paragraphs), my sense is that the market will definitely have more downside to go in the coming weeks before we can enjoy a more sustainable rally. In the above chart, I mentioned a reading of 60% or below. However, this author would still like to see a reading of 50% (or even below) in this survey before I could reasonably call for the beginning of a "blow off" top.
Without further ado, let's strive to end this commentary by taking a final look at the Consumer Confidence Index and how it has "performed" relative to the U.S. stock market as measured by the Dow Industrials. Following is a monthly chart showing Consumer Confidence (as measured by the Conference Board) vs. the DJIA from January 1981 to June 2005. The fact that the stock market has rallied on an intraday basis on the "strength" of the Consumer Confidence number is very ironic, as historically, the market has subsequently underperformed over the longer-run whenever we have seen relatively high readings in Consumer Confidence:

The latest June Consumer Confidence number was released on June 28th. Please note that this reading of 105.8 is now at a three-year high, and from a contrarian standpoint, this is bearish. Like I have said in my previous commentaries, I would like to see a Consumer Confidence reading of 90 or below before we would be willing to initiate longer-term long positions in the stock market. The only downside to following this indicator is that these readings are only released once a month. Investors may find out that they have "missed the train" if one is to only follow this sentiment indicator. This is the major reason why we have not consistently discussed the Consumer Confidence Index in our commentaries.
Conclusion: Again, the Summer/Fall correction that I have been looking for during the last few weeks is finally coming to fruition - although this upcoming week should be very quiet as everyone is waiting for the release of quarterly earnings reports over the next several weeks. My sense is that these reports could be the trigger for a more significant correction, but we will see. For now, we will remain neutral - in cash, and waiting for a more oversold condition before initiating long positions. Whether this will lead to a "blow off" rally I cannot be 100% sure, but the chances of that during the next to two to four months is definitely very high - especially given the immense amount of short interest and the relative cautiousness of retail investors and fund managers. Over the next 12 to 18 months, the potential for the U.S. Dollar to continue to rally is very high - particularly against the Euro. Moreover, I believe the unwinding of the US$ carry trade is at hand - possibly to be replaced by a Euro carry trade going forward. I continue to be bearish on commodities, particularly on copper and crude oil. I also don't like the prospects of gold in the next 9 to 12 months - as the increasing demand for the precious metal should slow down given the continuing slowdown in the global economy and particularly in China and India.
Signing off,


