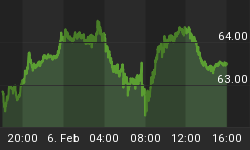
Zero Interest Rate Policy (ZIRP) was instigated by a credit induced collapse of the US financial system and perpetuated in December of 2008 by desperate financial policy makers as a fix to problems they created in the first place.
In reality, it is simply an epic distortion of normal economic signals that cleaned up the mess created by previous policy distortions (like the commercial credit bubble of the Greenspan era) by systematically (5+ years and running) main lining new distortions into the system.

So in addition to this picture, which could one day hang in a monetary museum with the title 'Grandma and Her Savings Account Bail Out Wealthy Asset Owners', let's take a walk down memory lane and marvel at some other pictures created by this policy...

The venerable S&P 500 is in the 6th year of a bull market. At some point over the last year or so the public finally became aware of the bull market in US stocks; 4+ years in.

As the public came in, momentum came into the market for the first time, especially in big tech. Bears hold prospects for the little topping pattern way up there, but so far that is a drop in the bucket compared to the upside this market has seen.

Of course, the object of policy making has been at least two-fold; bail out the big banks (the pigs at the trough), and create a stock bull market to increase household net worth on paper, through ownership of stocks. The BKX, while weak lately, quadrupled over the last 5 years.

Gold at first did what it was supposed to do, acting as liquidity and leading asset markets out of the price destruction of the melted down prior credit bubble. Then a funny thing happened, Europe sprung a leak to compound global credit fears and gold experienced an upside blow off in 2011 as players the world over knee jerked into the honest money value retainer.

That was of course after silver had sucked in every last commodity (and inflation) bull as the commodity echo bubble blew out in early 2011.

So what was left? Why Google of course! A truly great company that was in a long and bullish consolidation as we noted at the time.

But then some not-so-great companies got in on the act. It is no coincidence that major financial operators ran a promotion on 3D Systems in particular and 3D Printing (AKA 'additive manufacturing') in general just as the public got re-involved in the markets. There were plenty of other momentum sectors that blew off and have now tanked as these late investors got what they deserved, and what Wall Street served.

Of course it is not just over valued and junk stocks that have been manically bulled, so too have junk bonds. Where in 2008, people had gone so risk off so as to be monetarily traumatized, in 2014 they have become so bullishly deranged that they will accept the debt of the least trustworthy entities for ever decreasing interest return.

From MacroTrends comes this view of the monetary value asset as measured in base paper and digital money. By this measure, gold certainly was a bubble in 1980. Now? Not so much. What is in a bubble is peoples' willingness to accept an equal and opposite stance to the over bearish, over gloomy one of 5 years ago. Mission accomplished Federal Reserve; Everyone into the pool!

Also from MacroTrends, we present a picture for the happy and bullish people who support current policy making and financial engineering in general. Mainstream economists and market strategists can trot out bushels of data that confirm the good job our policy makers have done in cleaning up 2008's mess. Taken at face value, the above is a picture of increasing employment and decreasing debt. That is a good thing.

But the current bubble is not in total 'total credit', is it? No, the current bubble is in policy making and official credit. There is ZIRP in black (chart via SlopeCharts), maintaining and sustaining the stock bull market even as stocks slip into and out of positive correlation to 10 year yields (green).
We continue to consider that through not only the unprecedented duration of ZIRP but also various engineering of the yield curve and its nominal longer term components (QE and especially the inflation-sanitized Operation Twist) price signals in this market are, to use a highly technical term, really screwed up.
So we are set adrift and Wall Street's strategists and associated media not only work up great touts like the Great Promotion Rotation into stocks and out of bonds (how's that working out in 2014?) and the above mentioned 'Additive Manufacturing' revolution (ha ha ha... you know I have a special spot for this one since I am from the US manufacturing sector), but they busily extrapolate more good times ahead while sweeping under the rug the truth many of the pictures above portray.
What is that truth you ask? In 2014 we have come full circle to a fully opposite state from unsustainable over bearishness and gloom that was in force from Q4 2008 through Q1 2009. ZIRP has punished savers and prudent people every step of the way and rewarded asset owners over and over again.
If the Fed is all powerful as so many have come to believe, Janet Yellen can continue to be coy about the Fed Funds rate as long as she wants. This would theoretically sustain the policy bubble indefinitely. But given the steroidal policy inputs to the financial markets ongoing for 5+ years, right minded people should be aware that distortions have a funny way of coming to the surface when least expected. Again, we are 180° from March, 2009. People have moved on from the doom and gloom.


