• 699 days Will The ECB Continue To Hike Rates?
  • 699 days Forbes: Aramco Remains Largest Company In The Middle East
  • 701 days Caltech Scientists Succesfully Beam Back Solar Power From Space
  • 1,101 days Could Crypto Overtake Traditional Investment?
  • 1,106 days Americans Still Quitting Jobs At Record Pace
  • 1,108 days FinTech Startups Tapping VC Money for ‘Immigrant Banking’
  • 1,111 days Is The Dollar Too Strong?
  • 1,111 days Big Tech Disappoints Investors on Earnings Calls
  • 1,112 days Fear And Celebration On Twitter as Musk Takes The Reins
  • 1,114 days China Is Quietly Trying To Distance Itself From Russia
  • 1,114 days Tech and Internet Giants’ Earnings In Focus After Netflix’s Stinker
  • 1,118 days Crypto Investors Won Big In 2021
  • 1,118 days The ‘Metaverse’ Economy Could be Worth $13 Trillion By 2030
  • 1,119 days Food Prices Are Skyrocketing As Putin’s War Persists
  • 1,121 days Pentagon Resignations Illustrate Our ‘Commercial’ Defense Dilemma
  • 1,122 days US Banks Shrug off Nearly $15 Billion In Russian Write-Offs
  • 1,125 days Cannabis Stocks in Holding Pattern Despite Positive Momentum
  • 1,126 days Is Musk A Bastion Of Free Speech Or Will His Absolutist Stance Backfire?
  • 1,126 days Two ETFs That Could Hedge Against Extreme Market Volatility
  • 1,128 days Are NFTs About To Take Over Gaming?
The Problem With Modern Monetary Theory

The Problem With Modern Monetary Theory

Modern monetary theory has been…

What's Behind The Global EV Sales Slowdown?

What's Behind The Global EV Sales Slowdown?

An economic slowdown in many…

Another Retail Giant Bites The Dust

Another Retail Giant Bites The Dust

Forever 21 filed for Chapter…

  1. Home
  2. Markets
  3. Other

USD/JPY: Persistent Selling Pressure

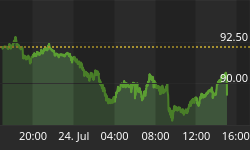
USD/JPY has broken the hourly support at 101.85, indicating persistent selling pressures. A support stands at 101.43. Resistances can be found at 102.36 and 103.02.

A long-term bullish bias is favoured as long as the key support 99.57 (19/11/2013 low) holds. Monitor the support area provided by the 200 day moving average (around 101.16) and the rising trendline from the 93.79 low (13/06/2013). A major resistance stands at 110.66 (15/08/2008 high).

Daily Technical Report


Read the Report

Back to homepage

Leave a comment

Leave a comment