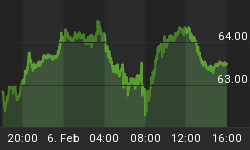
S&P500 has turned bearish in this week and even accelerated lower yesterday. More importantly, prices fell through the channel support line connected from 1803 low, and also moved slightly beneath wave (e) swing low of a wave B triangle. Such price action, especially broken upward channel suggests that market completed a three wave rise from 1803 to 1898. With that said, we assume that market will continue lower now within wave C) that is part of a corrective blue wave (4) that can be a flat.
S&P500 4h Elliott Wave Analysis

Crude Oil has turned bearish in mid-April when we called a bearish reversal after a very high but still only a three wave rally from 96.40 to 104. Notice that from that high market fell down in five waves through the support line connected from March lows. This five wave decline and breakout confirms the bearish trend that may resume very soon as rally from 98.70 also looks corrective, and now testing that broken line that can turn into the resistance around current levels. Ideally market will turn bearish in the next couple of days.
OIL 4h Elliott Wave Analysis

GOLD is moving sideways in 1268-1331 range for more than a month between two contracting trend-lines that make a shape of a triangle. We are looking at a running triangle in wave (b) that can be near completion as rise from 1276 is already in three legs that represents wave e), final leg in the pattern. With that in mind, traders should be aware of a bearish reversal down in wave (c) towards 1220/40 especially once 1277 and pattern support will give way.
GOLD 4h Elliott Wave Analysis

Interested in our analysis? Get now 1 month of full service for just 1€. http://www.ew-forecast.com/service
Free ELLIOTT WAVE Webinar - Trading With The Wave Principle | Register For Free Webinar


