



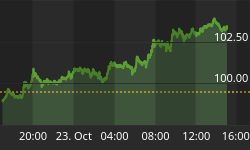


Last analysis expected a little upwards movement to the target at 102.14 to 102.61 to last about five days. So far upwards movement has reached 102.99 and has lasted six days from last analysis.
Summary: I expect that upwards movement is over for now. A clear breach of the channel on the hourly chart would provide me with confidence that the middle of a third wave down has started. The target for the next wave down is 92.91 and may be reached in two to three weeks.

The daily chart shows all of the start of cycle wave c downwards.
Minor wave 1 subdivides perfectly as an impulse. Minor wave 2 an expanded flat correction which is a 66% correction of minor wave 1.
At 72.53 minor wave 3 would reach 1.618 the length of minor wave 1. Minor wave 1 lasted 65 days, and I would expect minor wave 3 to be extended so longer in duration. It may last a total Fibonacci 89 days.
Minor wave 1 lasted 65 days and minor wave 2 lasted 67 days. Minor wave 3 is likely to be extended and so should last longer than 65 days. It may complete in a total Fibonacci 89 days.
I have slightly adjusted the base channel about minor waves 1 and 2 to a "best fit" channel. I would expect upwards corrections to find resistance at the upper edge of this channel, and the third wave down should have enough momentum to break through support at the lower edge of the channel.
Minuette wave (ii) may not move beyond the start of minuette wave (i). This wave count is invalidated with movement above 104.99.

At this stage it looks likely that minuette wave (ii) is now over; the structure is complete. However, I would use the channel drawn about it to confirm the resumption of the downwards trend. When this channel is clearly breached by at least one or two hourly candlesticks below the lower edge and not touching the lower trend line then I would have confidence that the middle of a third wave down is underway.
If minuette wave (iii) begins at 102.99 then at 92.91 it would reach 1.618 the length of minuette wave (i). If minuette wave (ii) moves higher then this target would need to be recalculated.
Once the channel is breached I would expect downwards movement to continue and downwards momentum to increase strongly.
Minuette wave (ii) may not move beyond the start of minuette wave (i) above 104.99.





