• 496 days Will The ECB Continue To Hike Rates?
  • 496 days Forbes: Aramco Remains Largest Company In The Middle East
  • 498 days Caltech Scientists Succesfully Beam Back Solar Power From Space
  • 898 days Could Crypto Overtake Traditional Investment?
  • 902 days Americans Still Quitting Jobs At Record Pace
  • 904 days FinTech Startups Tapping VC Money for ‘Immigrant Banking’
  • 907 days Is The Dollar Too Strong?
  • 908 days Big Tech Disappoints Investors on Earnings Calls
  • 909 days Fear And Celebration On Twitter as Musk Takes The Reins
  • 910 days China Is Quietly Trying To Distance Itself From Russia
  • 911 days Tech and Internet Giants’ Earnings In Focus After Netflix’s Stinker
  • 915 days Crypto Investors Won Big In 2021
  • 915 days The ‘Metaverse’ Economy Could be Worth $13 Trillion By 2030
  • 916 days Food Prices Are Skyrocketing As Putin’s War Persists
  • 918 days Pentagon Resignations Illustrate Our ‘Commercial’ Defense Dilemma
  • 918 days US Banks Shrug off Nearly $15 Billion In Russian Write-Offs
  • 922 days Cannabis Stocks in Holding Pattern Despite Positive Momentum
  • 922 days Is Musk A Bastion Of Free Speech Or Will His Absolutist Stance Backfire?
  • 923 days Two ETFs That Could Hedge Against Extreme Market Volatility
  • 925 days Are NFTs About To Take Over Gaming?
Stock Barometer

Stock Barometer

Stock Barometer

Stock Barometer is completely independent. We have never and will not ever accept compensation from any company whose stock we recommend. Our goal is to…

Contact Author

  1. Home
  2. Markets
  3. Other

Simple and Complex

5/22/2014 5:56:15 AM

Good morning traders,

As the QQQs reach the top of the left shoulder, you can see the rule of alternation in action as you have a simple left shoulder, and a complex right shoulder.

QQQ Daily Chart

That being said, even with this right shoulder coming on very light volume (we're seeing the lightest trading volume of the year on the markets) there's nothing that says the market can't continue higher here and if it breaks the previous highs, we'd simply look at the pattern as a broadening top pattern.

Also note the level of selling that came in on the down days during the last decline. If we don't see that action develop today or tomorrow, then you would have to believe we'll head higher into July.

On the bullish front:

AAII % Bulls Chart

Now this data series is also unique as the level of those neutral on the markets remains at an all time high. I expect these readings to moderate.

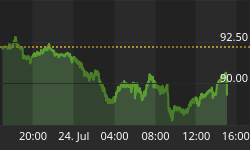
And finally, a shout out to our Oil Options Trader service, just checking our last oil options play and it's up over 100% - nothing like back to back 100% gains and this trade could keep going! The opportunities in commodities are great if you catch them. Visit www.stockbarometer.com to learn more. Here's one of the reasons we think this trade could run:

Oil Leading Indicator Chart

Regards,


Also, to see the article where we recommended the call options for this play, visit http://investmentresearchgroup.com/Blog/


Back to homepage

Leave a comment

Leave a comment