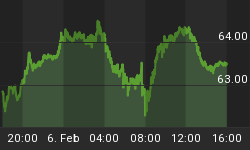
Two week ago I first called for patience regarding Gold's expected Investor Cycle (Investor Cycles run 24 weeks) decline. Since then, Gold has continued to chop sideways in a largely lifeless and apathetic manner. The few price spikes we've seen have typically come during thinly traded markets, with little follow-through and prices that close near where they opened.
The current price action is why the Bollinger Bands have constricted so tightly. The trading range has narrowed with each passing day, and volatility is now at an extreme low. The lack of volatility is reflected in the 2nd tightest set of Bollinger Bands since the start of the bull market 14 years ago. Regular readers will know that I place significant predictive value on instances where tight Bollinger Bands occur near expected Cycle pivots.
My current Gold analysis is beginning to sound repetitive, so I hope my call for patience will continue to be heard. The facts have not changed - Gold is in the timing band for a Daily Cycle Low (DCL), but has yet to complete a recognizable Cycle Low. Because moves out of tight Bollinger Bands are almost always fast and extreme, I expect that to happen this time as well. And the evidence continues to support the idea that the coming move will be sharply lower into a DCL.

Even though we're expecting a sharp decline, such a drop could be good news for Gold bulls. If the coming Daily Cycle Low holds above $1,179, it should be an extremely bullish event. Cycle Lows serve as important, sentiment clearing events, and are necessary if a sustained move higher is to follow. In addition, with Gold on week 21 of an Investor Cycle (which normally runs between 22-26 weeks), we could well be looking at an Investor Cycle Low at the same time, one which could also mark a significant turning point in Gold's longer term outlook.
My goal has always been to assess asset price behavior in as unbiased a way as possible, focusing on the most probabilistic Cycle outcomes. But like any technical discipline, Cycles are not absolute; there is room for interpretation, and an allowance for alternative scenarios must be made. I don't look to sensationalize my analyses, and they should not (and cannot) be presented in terms designed to give the illusion that they are foolproof. Cycle analysis is all about determining the most probable outcomes.
With Gold's current setup, we've finally reached a significant Cycle pivot...and I believe that we are likely to be treated to a very surprising turn of events. Directly ahead is, I believe, a major turn and rally for Gold. I can't be certain of the exact timing, since there exists the possibility of another Daily Cycle (in the current Investor Cycle) which could stretch into late June, but I need to reiterate my belief that Gold's bear market ended last year, in June. To confirm that Gold's bear market is over, the coming Investor Cycle Low (ICL) will need to hold above the prior two ICLs ($1,179). If this plays out, the coming decline from tight Bollinger Bands should see the bears pile in on the short side, driving Gold's price toward the level of the last ICL. At some point, price should reverse sharply, trapping the bears and punishing them with a rally fueled by Short covering.

In August of last year, my call of an end to Gold's bear market was based both on anecdotal evidence and my experience reading the tape. But it wasn't until the successful retest of the low in December that Cycles truly supported the idea that a bottom was in. And now, with the approach of the 2nd ICL since the June 2013 bottom, Gold appears to have formed a wide and bullish foundation upon which the next bull market will be built.
The last Yearly Cycle Low occurred in June of 2013, making the coming YCL very important in confirming the end of the bear market. I expect that Gold will hold above $1,179, giving us both a 2nd straight Investor Cycle above the June 2013 Low and, more importantly, a successful retest of the last June's Yearly Cycle Low. If the retest is successful, Gold will have completed a very bullish inverse monthly H&S pattern, and a sharp counter-trend rally will be almost assured. Gold's moves out of Yearly Cycle Lows are often explosive, and there is no reason to expect that this time would be different. A new rally should be intense, and my expectation is for a move back to prior resistance around $1,520.

The Financial Tap publishes two member reports per week, a weekly premium report and a midweek market update report. The reports cover the movements and trading opportunities of the Gold, S&P, Oil, $USD, and US Bond Cycles. Along with these reports, members enjoy access to three different portfolios and trade alerts. As these portfolios trade on varying timeframes (from days, weeks, to months), there is a portfolio to suit all member preferences.
LIMITED TIME PROMOTION. You're just 1 minute away from profitable trades! please visit http://thefinancialtap.com/landing/try# and ENTER PROMO CODE: 29off This will reduce ANY product by $29 (including the annual).


