


6/2/2014 8:43:45 AM
Canaries stall...
Recommendation: Take no action.
Click here to access our stock market chat rooms today! For a limited time, try our chat room for free. No subscription necessary to give it a try.
Stock Market Trends:

- ETF Positions indicated as Green are Long ETF positions and those indicated as Red are short positions.
- The State of the stock market is used to determine how you should trade. A trending market can ignore support and resistance levels and maintain its direction longer than most traders think it will.
- The BIAS is used to determine how aggressive or defensive you should be with an ETF position. If the BIAS is Bullish but the stock market is in a Trading state, you might enter a short trade to take advantage of a reversal off of resistance. The BIAS tells you to exit that ETF trade on "weaker" signals than you might otherwise trade on as the stock market is predisposed to move in the direction of BIAS.
- At Risk is generally neutral represented by "-". When it is "Bullish" or "Bearish" it warns of a potential change in the BIAS.
- The Moving Averages are noted as they are important signposts used by the Chartists community in determining the relative health of the markets.
Best ETFs to buy now (current positions):
Long DIA at $161.48 as of December 19, 2013
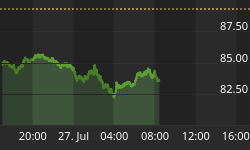
Long QQQ at $85.99 as of December 19, 2013
Long SPY at $181.19 as of December 19, 2013
Click here to learn more about my services and for our ETF Trend Trading.
Value Portfolio:
Long SDRL at $33.90 on June 15, 2012 (Shares were put to us when options expired. We were paid $1.10 per share when we sold those options and bought shares for $35.00 each). We have collected dividends: March 5, 2014 $0.98, December 3, 2013 $0.95, September 5, 2013 $0.91, June 5, 2013 $0.88, $1.70 Dec 4, 2012, $0.84 Sep 4, 2012. Total = $5.28 in dividend payments.
Short FXE at $124.19 on August 24, 2012
Long UUP at $22.43 on August 24, 2012
Short FXE at $134.48 on October 4, 2013
Long SDRL at $35.43 on Feb 18, 2014
Long SDRL at $33.50 on March 21, 2014 (Shares were put to us when options expired. We were paid $1.50 per share when we sold those options and bought the shares for $35.00 each.
We publish new reports to our free newsletter every month. If you're not a member, sign up by clicking here: Free Stock Market Newsletter
Equities opened slightly lower then dipped during the first half hour of trading before reversing to head higher through the rest of the morning. The lunch hour started with selling and that selling continued into early afternoon. A bit before 2:00pm, buyers emerged who drove prices higher into the close allowing the NASDAQ-100 to achieve a multi-year closing high and with the Dow and S&P-500 to achieve all-time closing highs. All three posted fractional gains and are above their 20-, 50-, and 200-Day Moving Averages (DMAs). The Dow maintained its trading state while the NASDAQ-100 and S&P-500 maintained their uptrend states. The Dow Jones Transports (IYT 145.31 -0.04) closed flat while the Semiconductor Index (SOX 599.58 +0.73) added a modest gain. Both remain above their 20-, 50- and 200-DMAs in uptrend states. The Russell-2000 (IWM 112.86 -0.51) posted a fractional loss closing even with its 50-DMA but above its 20-, and 200-DMAs. The Bank Index (KBE 31.93 +0.03) added a modest gain while the Regional Bank Index (KRE 38.29 -0.02) saw a modest loss. Both closed below their respective 50- and 200-DMAs but above their 20-DMAs. All three remain in trading states. The Finance Sector ETF (XLF 22.29 +0.05) added a fractional gain and remains above its 20, 50-, and 200-DMAs in an uptrend state. Longer Term Bonds (TLT 114.10 -0.05) closed flat. It closed above its 20-, 50- and 200-DMAs and is in an uptrend state.. Trading volume was average with 916M shares traded on the NYSE. Trading volume on the NASDAQ was nearly average with 1.816B shares traded. There were five economic reports of interest released:
- Personal Income (Apr) rose +0.3% as expected
- Personal Spending (Apr) fell -0.1$ versus an expected +0.2% rise
- PCE Prices Core (Apr) rose +0.2% as expected
- Chicago PMI (May) came in at 65.5 versus an expected 60.3
- UofMichigan Consumer Sentiment - Final (May) came in at 81.9 versus an expected 81.4
The first three reports were released an hour before the open. The other two reports were released during the first twenty-five minutes of trading.
We are watching gold for a potential reversal in the Gold Miners Index (GDX 22.50 +0.26) added one percent as the price of Gold (GLD 120.43 -0.51) continued to slide. Both closed below their 20-, 50-, and 200-DMAs. This is the second day of divergence between gold miners and the price of gold. It appears that traders jumped the gun buying when GDX reached oversold conditions. Gold didn't bounce off of oversold conditions and the resolution of the divergence will be interesting to trade.
Apple (AAPL 633.00 -2.38) slipped fractionally. AAPL constitutes about 20 percent of the NASDAQ-100 and nearly five percent of the S&P-500.
Seadrill Limited (SDRL 38.00 -0.38) lost one percent from overbought conditions. It is in an uptrend state. We sold March 2014 $35.00 put contracts for $150 at the open on Feb 18th and bought shares at $35.43. The stock is now trading ex-dividend for $0.98. The shares were put to us at $35.00 less the $1.50 per share we were paid for the puts, so we have an effective price of $33.50.
The U.S. dollar slid two tenths of one percent while the Euro rose a like amount.
The yield for the 10-year treasuries rose a single basis point to close at 2.46. The price of a barrel of crude oil fell eighty-seven cents to close at $102.71.
The implied volatility for the S&P-500 (VIX 11.40 -0.17) slipped one percent and remains well below its 200-DMA. The implied volatility for the NASDAQ-100 (VXN 13.77 -0.07) fell fractionally and remains well below its 200-DMA.
Market internals were mixed with advancers edging decliners on the NYSE whlie decliners led advancers 8:5 on the NASDAQ. Down volume edged up volume on the NYSE and down volume led up volume 3:2 on the NASDAQ. The index put/call ratio rose +0.24 to close at 0.99. The equity put/call ratio rose +0.04 to close at 0.56.
Conclusion/Commentary
Friday saw an increase in trading volume but only to below average or average levels. Friday usually sees an increase in trading volume as it is the day that weekly options expire. With that said, the divergence between the major indexes and the canaries (Russell-2000, the bank index, and the regional bank index) was notable as the canaries struggle to shift to a bullish stance. While the Russell-2000 is above its 200-DMA, the other two have not been able to achieve a definitive move above their respective 200-DMAs. With the NASDAQ-100 closing at a multi-year high and the Dow and S&P-500 closing at all time highs, the major indexes are breaking out higher. The bulls will not be comfortable until the canaries are strongly above their respective 200-DMAs. In addition to this, longer term bonds retreated as expected on Thursday but held their ground on Friday. There is no reason to buy longer term bonds except as a fear trade or for foreign governments to control the exchange rates of their currencies. We believe that the latter is the main reason bond prices have held up recently. We will remain long equities until the markets indicate a directional move of high probability ahead in the near future.
We hope you have enjoyed this edition of the McMillan portfolio. You may send comments to mark@stockbarometer.com.


