


6/15/2014 9:09:14 PM
Market Summary
The market recovered a bit on Friday after prices ended lower the previous three consecutive days. Bullish results from the tech sector held the market up at week's end but most of the major indexes had a losing week which snapped a multi-week series of gains. Reuters reported that analysts are worried about the impact a protracted period of high commodity prices could have on economic growth, especially with indexes near record levels.
The June 8th Weekly Update Market Summary said "The performance graph shows for the first time this year all the major equity indexes are in the green year-to-date at the same time. Stocks and bonds are floating at historically high levels. The equity market has kept moving higher despite mixed signals about the growth potential of the U.S. economy. The next watermark of stocks is 2,000 for the S&P500 index, which is just 2.5% above its current price." The updated graph below shows the major indexes are still holding on to their gains for the year after a down week.

Recent Weekly Update articles mentioned "defensive sectors are leading the charge. It's this rotation to 'risk-off' stocks that we interpret to mean upside potential is limited over the next few months.what is clear is that investors are seeking yield. Note the highest performing sectors are utilities, treasury bonds, and real estate which all provides high yields compared to all the other sectors...as investors fear has diminished to very low level, they have developed an appetite for risk...investors are moving out of the higher yielding utilities and Treasury bond sectors back into the high growth stocks like financials and technology." In the updated graph below you can see for the past few weeks 'risk on' categories have been the best performing sectors as small caps, energy and financials are leading the market higher. While the heretofore high yield investment categories are the worst performing sectors the past few weeks. The rotation back to riskier stocks signals further upside potential, but also means these will be the shares that drag the market lower during the next pullback.

Market Outlook
The upcoming week is known as 'Triple Witching Week' when the contracts for stock index futures, stock index options and stock options all expire on the same day. Triple witching days happen four times a year on the third Friday of March, June, September and December. This phenomenon is sometimes referred to as "freaky Friday". The final trading hour for that Friday is the hour known as triple witching. The markets are quite volatile in this final hour, as traders quickly offset their option/futures orders before the closing bell. It has been report that the second Triple Witching Week of the year brings on some volatile trading with losses frequently exceeding gains. On Monday of Triple-Witching Week the DJIA has been down ten of the last seventeen years. Triple-Witching Friday is better, up eight of the last eleven years, but weaker over the past 21 years, up twelve, down nine with an average loss of 0.2%. Full-week performance is choppy as well, littered with greater than 1% moves in both directions. The weeks after Triple-Witching Day are horrendous - this week has experienced DJIA losses in 21 of the last 24 years with average losses of 1.1%. S&P 500 and NASDAQ have fared slightly better during the week after over the same 24 year span, declining 0.8% and 0.2% respectively on average.
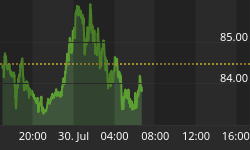
Below is the updated Heikin-Ashi chart we have used in the past. Heikin-Ashi charts are similar to the Japanese candlesticks charts you are probably used to seeing. Heikin-Ashi candlestick charts are designed to filter out volatility in an effort to better capture the true trend. In Japanese, Heikin means "average" and "ashi" means "pace". Taken together, Heikin-Ashi represents the average-pace of prices. Heikin-Ashi Candlesticks are not used like normal candlesticks; instead, these candlesticks can be used to identify trending periods, potential reversal points and classic technical analysis patterns. The chart supports the contention that upward momentum is waning with downward price pressure to relieve overbought conditions.

The CBOE Volatility index (VIX) gained 10% for the week after Thursday's big selloff triggered a spike. As we said before". CBOE Volatility index (VIX) sank to the lowest level since 2007. the VIX, which tends to rise when volatility increases or the market drops, has been on the decline for months and is well below its historical average of 20." Notice in the updated chart below how as the S&P 500 index has moved higher during the current bull market the VIX has trended toward all-time lows.

Last week we said "retail investors have jumped on board with the major equity indexes at all-time highs. The bullish percentage has climbed to its long term average primarily at the expense of bearish sentiment, which has gotten extremely low. Analysts who regard the AAII survey as a contrarian indicator can make the case that the low bearish reading coupled with the excessive neutral percentage hint stocks are due for a pull back. The most probable expectation is a price pause in the current bullish move as the major equity indexes absorb overbought conditions." As you can see in the updated survey below, from a contrarian perspective, retail investor sentiment is becoming excessively optimistic. It is generally assumed most retail investors are wrong about market direction, therefore contrarians are betting on a near-term market top to relieve the overly bullish reading.

Previous analysis of National Association of Active Investment Managers (NAAIM) exposure index said "Professional money managers have gotten on board with the current bullish trend as their latest index is higher than last quarter's NAAIM 84.40% average reading. Another factor contributing to money managers' putting more funds to work is the need to rebalance their portfolios for the second quarter window dressing due at the end of the month..." Money managers' current exposure is 87.30% and you can expect a continued high reading as rebalancing continues.

Trading Strategy
The longer term trend is still bullish, but the current overbought condition will probably produce a near-term neutral trend with short-term pullbacks. Also remember that for the past few years the market usually stalls pre-earnings season and presents the opportunity to bid on long bullish moves. As we said recently "small caps and technology shares leading the market higher the past month.the small cap Russell 2000 found a support level where the price is bouncing off of when earning season begins in a month or so you may be able to get some quick gains from making bets on smaller cap stock that are on your watch list." A price pull back is probably a good opportunity to bid on small cap stocks that you like.
We also opined "gold prices appear to have bottomed out a support line that has been in place since the beginning of the year. Now is probably an opportune time to look at setting up trades that will profit if gold does bounce off its support level. Gold appears to be bouncing off a support level that has held up the price all year." This analysis is on target. As you can observe in the updated chart below your bullish trades to take advantage of the bounce off support should already be profitable with gains continuing to run.

As we have discussed recently, "In the current environment, it is prudent to maintain tight stops with proper position sizing for long trades (whether bullish or bearish). As we have demonstrated in our trading newsletters, spread trading works well in this market as the trades are less expensive and positions are protected if the trade goes against you.
Regards,


