• 703 days Will The ECB Continue To Hike Rates?
  • 704 days Forbes: Aramco Remains Largest Company In The Middle East
  • 705 days Caltech Scientists Succesfully Beam Back Solar Power From Space
  • 1,105 days Could Crypto Overtake Traditional Investment?
  • 1,110 days Americans Still Quitting Jobs At Record Pace
  • 1,112 days FinTech Startups Tapping VC Money for ‘Immigrant Banking’
  • 1,115 days Is The Dollar Too Strong?
  • 1,115 days Big Tech Disappoints Investors on Earnings Calls
  • 1,116 days Fear And Celebration On Twitter as Musk Takes The Reins
  • 1,118 days China Is Quietly Trying To Distance Itself From Russia
  • 1,118 days Tech and Internet Giants’ Earnings In Focus After Netflix’s Stinker
  • 1,122 days Crypto Investors Won Big In 2021
  • 1,122 days The ‘Metaverse’ Economy Could be Worth $13 Trillion By 2030
  • 1,123 days Food Prices Are Skyrocketing As Putin’s War Persists
  • 1,125 days Pentagon Resignations Illustrate Our ‘Commercial’ Defense Dilemma
  • 1,126 days US Banks Shrug off Nearly $15 Billion In Russian Write-Offs
  • 1,129 days Cannabis Stocks in Holding Pattern Despite Positive Momentum
  • 1,130 days Is Musk A Bastion Of Free Speech Or Will His Absolutist Stance Backfire?
  • 1,130 days Two ETFs That Could Hedge Against Extreme Market Volatility
  • 1,132 days Are NFTs About To Take Over Gaming?
What's Behind The Global EV Sales Slowdown?

What's Behind The Global EV Sales Slowdown?

An economic slowdown in many…

Is The Bull Market On Its Last Legs?

Is The Bull Market On Its Last Legs?

This aging bull market may…

  1. Home
  2. Markets
  3. Other

Solar Energy Sector ETF Breaking Out - How to Trade It

During the past couple months several indexes, sectors and commodities have sold off more than 10 - 20%. But now some are looking like new buying opportunities. Over the next week I will bring a few of these trades to your attention as they start to unfold.

Today we are looking at the TAN solar ETF. This sector recently had a 23% hair cut in price. A 20-25% correction in price is a typical intermediate correction for a fast moving sector. The price correction has pulled the sector down to its 150 and 200 simple day moving averages. These levels tend to act as long term support for investors, a buying point.

Many of the individual stocks within this sector are starting to pop and breakout of bullish price patterns. These individual stock prices point to higher prices for TAN going forward.

Be aware of crude oil.... I do think that as long as the price of crude oil stays up solar stocks will continue to rise overall. But if oil starts to roll over and break down, TAN will struggle.


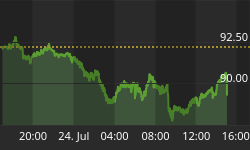
My Technical Take on The Chart:

Big picture analysis shows a powerful uptrend with bullish consolidation.

Intermediate analysis shows a falling bullish wedge, test of moving averages, and a reversal breakout pattern.

TAN Guggenheim Solar ETF NYSE

Short term analysis shows we are at a resistance level and we will likely see a pause of pullback over the next few days before it goes higher.

TAN Guggenheim Solar ETF NYSE


TAN Trading Conclusion:

If price closed back below the $39.00 I would consider this bounce/rally failed.


Disclaimer: I do not own shares of TAN as this point, but may buy some in the near future.

Get My Trade Ideas Delivered To Your Inbox FREE: www.GoldAndOilGuy.com


Back to homepage

Leave a comment

Leave a comment