


6/23/2014 8:44:46 AM
Quadruple Witching brings high volume...
Recommendation: Take no action.
Click here to access our stock market chat rooms today! For a limited time, try our chat room for free. No subscription necessary to give it a try.
Stock Market Trends:

- ETF Positions indicated as Green are Long ETF positions and those indicated as Red are short positions.
- The State of the stock market is used to determine how you should trade. A trending market can ignore support and resistance levels and maintain its direction longer than most traders think it will.
- The BIAS is used to determine how aggressive or defensive you should be with an ETF position. If the BIAS is Bullish but the stock market is in a Trading state, you might enter a short trade to take advantage of a reversal off of resistance. The BIAS tells you to exit that ETF trade on "weaker" signals than you might otherwise trade on as the stock market is predisposed to move in the direction of BIAS.
- At Risk is generally neutral represented by "-". When it is "Bullish" or "Bearish" it warns of a potential change in the BIAS.
- The Moving Averages are noted as they are important signposts used by the Chartists community in determining the relative health of the markets.
Best ETFs to buy now (current positions):
Long DIA at $161.48 as of December 19, 2013
Long QQQ at $85.99 as of December 19, 2013
Long SPY at $181.19 as of December 19, 2013
Click here to learn more about my services and for our ETF Trend Trading.
Value Portfolio:
Long SDRL at $33.90 on June 15, 2012 (Shares were put to us when options expired. We were paid $1.10 per share when we sold those options and bought shares for $35.00 each.) We have collected dividends: June 10, 2014 $1.00, March 5, 2014 $0.98, December 3, 2013 $0.95, September 5, 2013 $0.91, June 5, 2013 $0.88, $1.70 Dec 4, 2012, $0.84 Sep 4, 2012. Total = $6.28 in dividend payments.
Short FXE at $124.19 on August 24, 2012
Long UUP at $22.43 on August 24, 2012
Short FXE at $134.48 on October 4, 2013
Long SDRL at $35.43 on Feb 18, 2014
Long SDRL at $33.50 on March 21, 2014 (Shares were put to us when options expired. We were paid $1.50 per share when we sold those options and bought the shares for $35.00 each.) We have collected dividends: June 10, 2014 $1.00.
We publish new reports to our free newsletter every month. If you're not a member, sign up by clicking here: Free Stock Market Newsletter
Equities traded in a fairly narrow range and all equity indexes we regularly monitor finished higher. All equity indexes we regularly monitor are in uptrend states and all are above their 20-, 50-, and 200-Day Moving Averages (DMAs). All maintain a BULLISH BIAS. Longer Term Bonds (TLT 111.80 +0.84) added a strong fractional gain, despite the gains in equities. It closed below its 20-DMA but nearly even with its 50-DMA and is still above its 200-DMA. It has a NEUTRAL BIAS and maintains a trading state. Trading volume increased to an above average 1.117B shares traded on the NYSE. Trading volume on the NASDAQ was heavy with 2.451B shares traded.
There were no economic reports of interest released. Instead, the focus was on options expiration and closing out or rolling option contracts. This was definitely the heavies trading volumes we have seen. I was also the one day per quarter that many of the ETF Index funds paid a dividend, including DIA, SPY, QQQ, KBE, KRE, and XLF. The fact that most of these funds closed above their Thursday closing prices without accounting for the dividend indicates significant bullish resolve still exists.
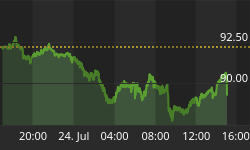
Apple (AAPL 90.91 -0.95) lost one percent. It has been falling since a 7:1 stock split on June 8th. AAPL constitutes about 20 percent of the NASDAQ-100 and nearly five percent of the S&P-500.
Seadrill Limited (SDRL 40.10 +0.54) broke out above its 200-DMA in dramatic fashion. The next target remains $40.96, it's closing price on the last trading day of 2013. It is in an uptrend state. We sold March 2014 $35.00 put contracts for $150 at the open on Feb 18th,2014 and bought shares at $35.43. The stock is now trading ex-dividend for $0.98 and one dollar for total dividends issued of $1.98. The stock fell back to just below its 200-DMA. The shares were put to us at $35.00 less the $1.50 per share we were paid for the puts, so we have an effective price of $33.50.
The U.S. dollar was nearly unchanged rising modestly. The Euro fell less than a tenth of one percent. The dollar continues to hover below its 200-DMA. The Euro is plumbing the depths at its recent lows. It closed well below its 200-DMA.
The yield for the 10-year treasuries was unchanged at 2.62. The price of a barrel of crude oil closed up forty cents at $106.83.
The implied volatility for the S&P-500 (VIX 10.85 +0.23) rose two percent bouncing off of its lowest level seen since before the financial crisis. The implied volatility for the NASDAQ-100 (VXN 12.27 -0.24) fell two percent reaching a multi-year low not seen since before the financial crisis. What does it mean? It means that there is a remarkable amount of complacency out there.
Market internals were bullish. Advancers led decliners 4:3 on both the NYSE and the NASDAQ. Up volume led down volume 11:10 on the NYSE and by 5:4 on the NASDAQ. The index put/call ratio fell -0.05) to close at 0.84. The equity put/call ratio rose +0.05 to close at 0.52.
Conclusion/Commentary
Friday was a quarterly phenomenon known as quadruple witching where stock index futures, stock index options, stock options and single stock futures all expire on the same day. This tends to bring high volume and can bring added volatility. Volatility was low but volume was the highest we have seen in months. With all equity indexes we regularly monitor finishing higher, all in uptrend state with a BULLISH BIAS, and all above their 20-, 50-, and 200-DMAs, all basic signs are bullish. The Dow and S&P-500 hit new all time highs. AAPL is keeping the NASDAQ-100 from hitting a new multi-year high and the other equity indexes appear poised to break recent highs as well. We remain cautiously optimistic here, maintaining long positions until we see a reversal sign.
We hope you have enjoyed this edition of the McMillan portfolio. You may send comments to mark@stockbarometer.com.


