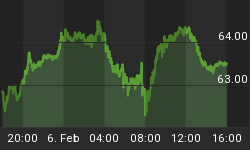
It is three weeks since the managed money category on Comex placed their biggest bet ever recorded in recent times that silver was going lower, and also bet big-time that gold would sink below $1200. As is often the case when traders are so commonly committed to a price outcome they end up nursing some painful losses.
To add to the bears' misery the technical analysis position is now turning positive for both metals. Silver for example has broken its three-year downtrend on good turnover, as shown in the chart below.

There is some work to be done on this chart before challenging major overhead supply at the $26 level, but it gives good initial scope on the bull tack.
The gold chart may also be finally breaking out on the upside, with the 200-day moving average at $1288 and beginning to trend upwards. For many traders the sequence of a price higher than its long-term moving average, when it is also rising, is the basic definition of a bull trend. The first major hurdle is $1420, and if the gold price can get through that, traders will be looking to take out potential supply at $1520+. This is shown in our second chart.

The shorts on Comex are unwinding quite rapidly, as one would expect. But turning bullish is never a simple matter for hedge funds and algorithmic traders, who often need to become bearish on something else, and here we need to look at fundamentals, particularly the economic outlook.
The most notable news on Wednesday was the sharp downward revision to US 1Q GDP, from an original annualised rise of 0.1% to a huge fall of 2.9%. The sting was made worse by the deflator, which at only 1.3% clearly underestimates true price inflation. Even the Government's fictitious deflator will probably register about 1.8% in Q2, close to the Fed's 2% target. As usual Wall Street analysts continue to be optimistic for Q2, but the signs from recent business and consumer surveys have tended to disappoint. Furthermore, initial official figures for Services Spending for April and May, representing 68% of GDP, show very little growth for the first two months of the current quarter.
On top of this bad news growth of the US$ Fiat Money Quantity slowed to a virtual halt in April, suggesting that underlying credit conditions are rapidly tightening. Tightening monetary conditions are bad news for an economy that appears to be slowing both sharply and unexpectedly, while prices are rising. They had a word for it: stagflation. These were the conditions that prevailed in the 1970s bull market for gold.
A combination of a slowing economy, tightening credit conditions and increasing price inflation also represents growing stress for the financial system. This appears to be taking the Fed by surprise according to recent FOMC minutes, so further intervention may be required. This could be a reason for traders to turn negative on equities and bullish for gold and silver in the coming months.
Next week's announcements
Monday. Japan: Housing starts, Construction Orders. Eurozone: M3 Money Supply, Flash HICP. UK: M4 Money Supply, Mortgage Approvals, Net Consumer Credit. US: Chicago PMI, Pending Home Sales.
Tuesday. Japan: Tankan Survey, Vehicle Sales. UK: Halifax House Price Index. Eurozone: Manufacturing PMI. US: Manufacturing PMI, Construction Spending, ISM Manufacturing.
Wednesday. Eurozone: PPI. US: ADP Employment Survey, Factory Orders.
Thursday. Eurozone: Composite PMI, Services PMI, Retail Trade, ECB Deposit Rate. UK: CIPS/Markit Services PMI. US: Initial Claims, Non-Farm Payrolls, Trade Balance, Unemployment, ISM Non-Manufacturing Index.
Friday. US: Public Holiday.


