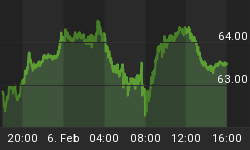
Gold and silver spent most of the week consolidating recent gains by moving broadly sideways, but their underlying strength was a notable feature. The first chart is of gold and its open interest on Comex.

The increase in open interest tells us that the rise in price was on the back of buying rather than a bear squeeze, which would have seen rising prices on steady-to-declining OI. This is an important development, because it indicates that speculators are beginning to think the downtrend of the last 30 months might be over. Without buying into a new rising trend, any rally would be limited to a bear squeeze.
It appears the bullion banks have increased their short positions, but there is possibly a good reason for this. If they had squeezed the bears and allowed the gold price to run up to, say, $1400, they would have shown larger losses on their short positions at the half-year. In other words, bullion banks dressing up their own profit and loss account took temporary precedent over trading strategy.
The silver chart looks different at first glance, with open interest declining sharply before picking up in the last few trading days. This is shown in the second chart.

The reason for the fall in OI in the second half of June was simply the expiry of the July contract when over 100,000 contracts had to be either closed or rolled into the next active month (September). That process is now complete, with some bulls understandably booking short-term profits. This being the case, we can now expect OI to climb again towards the 160,000+ region.
Base metals have had a new lease of life, partly reflecting dollar weakness and partly a bear squeeze in the wake of wild stories about multiple hypothecations of warehouse metal in Chinese ports. Platinum was a stand-out beneficiary, and gold and silver obviously benefited as well.
Perhaps the most interesting news this week was the House of Commons Treasury Committee called before it senior officials from the Financial Conduct Authority and the CEO of the London International Financial Futures Market to give evidence on the London gold market and the gold fix. The televised version can be found here.
It rapidly becomes apparent that the answers to the Committee's questions were inadequate. The second session, with Rhona O'Connell of Thompson Reuters and Alberto Thomas a lawyer from Fideres LLP appeared to confirm the Committee's worst fears about the London bullion market and the gold fix. As the Chairman, Andrew Tyrie summarised, "You've told us a pretty depressing story: the market has the potential to be rigged, that's it's not remotely competitive enough, that 10-30% of the days traded it's likely to have been rigged, that up to 40 basis points are likely to have been extracted from customers, and that regulators could and should have acted earlier, particularly after LIBOR. So is there any reason we should not be treating this as an appalling story?"
It is clear that the London gold market faces a radical overhaul, involving closer regulation and greater transparency. In this environment, bullion banks are likely to hold back on aggressive trading activity until the regulatory position clarifies.
Next week
Monday. Japan: Leading Indicator, Bank Lending Data, Current Account. Eurozone: Sentix Indicator
Tuesday. UK: Industrial Production, Manufacturing Production. US: Consumer Credit. Japan: Economy Watchers Survey.
Wednesday. Japan: M2 Money Supply, Key Machinery Orders.
Thursday. Japan: Consumer Confidence. UK: Trade Balance, BoE Interest Rate Decision. US: Initial Claims, Wholesale Inventories.
Friday. US: Budget Deficit


