


The following is part of Pivotal Events that was published for our subscribers June 26, 2014.
Signs Of The Times
"Investors are gobbling up riskier assets like never before."
- Wall Street Journal, May 27
"One of China's most important companies moved to secure metals held at 4 warehouses with concerns about fraud in commodities."
- Wall Street Journal, June 10
"Gold Stock ETFs: Outrageously Bullish"
- Market Letter, June 24
"Green Shoots Continue in US"
- Business Insider, June 24
This was a comment on a survey of Caterpillar dealerships.
And then there is the Conference Board survey on consumer confidence. The consensus number for June was 83.5 and the actual was 85.2 - the best reading since January 2008.
Stock Markets
We have been noting that economic and business reports would generally be positive until the bull market ends. Our above list of headlines continues positive and showing some volatility even the precious metals have generated a bold storyline.
Other technical measures have reached levels seen only at or near cyclical peaks. The "Fear & Greed" Index has increased to 93, indicating extreme greed. Well it is at a record.
Last week we noted that the street was, again, believing that the central bankers can "manage" a speculative bubble in the financial markets. This was the case going into May 2007 and "celebrated" in May 2008. The latter is from a quotation found on Page 5.
Our count was that the curve would likely reverse from inverted to steepening by June of 2007. Spreads would reverse to widening. By early June both had changed enough such that we called for the worst train wreck in the history of credit. Then Bear Stearns story moved very quickly from the discovery of insolvency to actual default.
This time around, we have thought that the curve would not invert so it could not provide a signal. We have been watching for lower-grade bond and spread markets to surge into May-June when the action could become vulnerable.
Banks (BKX) had a moderate rally to a Daily RSI of 76 at the end of December 2007 and the index reached 121 in February. Under the pressure of the mounting problems in subprime mortgage bonds the test of the high failed. In underperforming the S&P the banks provided a warning. In looking back, it was a "slow" warning.
This time around, the BKX reached an RSI of 76 on January 9th with the index climbing to 73.9 in March Actually there was a double top for the index at 73.9 and 73.0 in March.
This month a double top has been set at 71.8.
Taking out 70 would set the downtrend.
Wednesday's action clocked an Outside Reversal, along with other important indexes.
This was linked to the collapse of speculation in Dubai, which although a lesser exchange is important in the region. Often problems in regional exchanges can feed into the financial capitals. Well, where does the big hot money come from?
Credit Markets
Modern finance began in London in the 1680s when there were enough stocks and enough traders to make a market. This was made all the more modern in 1694 when the Bank of England was formed. The promoters of the Bank boasted that it would "infallibly" lower interest rates. There have been many bull and bear markets since and all within the usual cycle of booms and recessions. There has been six Great Bubbles and their consequent long contractions.
Within much of the Anglo-American market history, the senior central bank was dedicated to maintaining the gold reserve backing the currency. It was not attempting to rig financial markets. But in the 1920s intervention became massive and continuous.
The result has been monstrously wild bubbles and their consequent dislocations.
Until the past century, financial and commodity markets operated under the forces of negative feedback. Most systems in science and engineering survive because of negative feedback.
Positive feedback, by definition, drives a system to destruction.
Central bank intervention is not just arbitrary, it is a massive and seemingly unrelenting enforcement of positive feedback.
It has driven, for example, junk yields down to 5 percent, again. It has driven the Spanish yield, for example, down to 2.55%, which is without precedent.
However, there are enough of the public and bond trading desks in the game to provide some negative feedback. Besides that, at some point the central bankers will lose their nerve.
Their game had a sharp setback last June and an even more significant one in June 2007.
Of course, we know who is on the negative feedback "Dream Team".
Mother Nature and Mister Margin.
Junk to treasury spreads reached their best at the end of the year and widened moderately into May. The improvement since we have been taking as seasonal. The seasonal that can reverse around June, which means anytime now.
The Ted-Spread represents shorter maturities and it reached its best late in 2013 at a yield ratio of .154. It widened to .223 in February and April. Early in the month it narrowed to .197 and at .210 now, widening through .227 would set the trend.
The last such breakout was in mid-2011 and associated with the start of the European financial crisis that ended in 2012.
The bond future reached 138 and change late in May and became moderately overbought.
The correction was to 134.5 and it has been trading between 135 and 136.
The pattern needs a better test of the high.
Commodities
Crude oil rallied with the latest ME crisis from support at 101.60 to 107.68 when concerns were fresh. Last week it declined to support at the 105 level.
We turned to the "old" chart of seasonal tendencies for crude within the year. This "calls" for volatility in June-July and a rise into September.
Wheat became very oversold with dismal sentiment.
The momentum swing in the grains (GKX) from unusually high in April to exceptionally low two weeks ago. The index fell from 424 to 357 from which the initial bounce made it to 369 on Monday. The slip to 360 today looks like a test.
The degree of oversold suggests a tradable rally.
WEAT and CORN are the symbols for a couple of ETFs.
Over the past year, base metals (GYX) have built a "base". At 357 now, rising above resistance at 360 would be interesting.
Ampersand
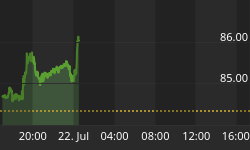
The salient event in June was not Janet Yellen renewing her vows to keep the depreciation going. It was the dramatic breakdown in the Dubai index (DFMGI). We were not watching this market and we are now. The rebound high was 5156 on June 3rd.
The low was 4009 on Tuesday.
This was an important climax of speculation that is unlikely to be "contained" and is an indicator for other highly speculative sectors. Technical details of the blow-off are reviewed and applied to the semi-conductor index. The chart follows.
This reminds of the speculative climax in Biotechs (IBB) in March.
Although it has had only one day, the feature of the week could be today's widening of spreads with long treasuries up in price as junk is down in price. Hitherto, widening was accomplished as treasuries rallied faster than junk.
The following boast was made in 2008 just as the rebound in the S&P was rolling over:
"Is The Financial Earthquake Over?
"U S policymakers deserve the Nobel Prize for applied economics. The policy respons e to financial asset deflation was not only extremely fast, but extremely well coordinated. The second-round effects of asset deflation have been contained."
- Business Times, Singapore, Investment Round Table, May 15, 2008
European Unemployment


- High unemployment is one of the features of the post-bubble world.
- Of interest is that the global business recovery out of the initial financial collapse has not brought the number down.
- How is the debt going to be serviced?
Junk Bonds In Never-Never Land

-
"Global investors are venturing to the riskiest corners of the US corporate debt market in greater numbers in a so-called 'Dash For Trash'."
"It is an avalanche of new issuance which is, by and large, of terrible quality."
- Financial Times, May 9, 2013
- Last year, from early May to late June the yield for junk soared from 5% to 6%.
Semi-Conductors Bubble

- The action has registered Upside Exhaustions on the Weekly and Daily readings.
- In March 2011 a good trade followed just the Weekly Signal.
- From a different technique the current reading is accompanied by a Sequential Sell Signal.
- On the more simpler Momentum(RSI) readings, it is the most overbought since February-March 2000.
We were not monitoring the outstanding rise in the Dubai market, but it is worthwhile reviewing the technical aspects of the blow-off.
This one "Rang the bell" with a "Trifecta" of Upside Exhaustions on the Daily, Weekly, and Monthly readings. A Sequential Sell also registered.
This diligence was applied to the obvious action in the SOX and SMH, which is almost as outstanding as Dubai.
Link to June 27th Bob Hoye interview on TalkDigitalNetwork.com: http://talkdigitalnetwork.com/2014/06/market-gyrations-signal-dangerous-times


