


7/7/2014 8:47:39 AM
Early close before Fourth of July brings record closes...
Recommendation: Take no action.
Click here to access our stock market chat rooms today! For a limited time, try our chat room for free. No subscription necessary to give it a try.
Stock Market Trends:

- ETF Positions indicated as Green are Long ETF positions and those indicated as Red are short positions.
- The State of the stock market is used to determine how you should trade. A trending market can ignore support and resistance levels and maintain its direction longer than most traders think it will.
- The BIAS is used to determine how aggressive or defensive you should be with an ETF position. If the BIAS is Bullish but the stock market is in a Trading state, you might enter a short trade to take advantage of a reversal off of resistance. The BIAS tells you to exit that ETF trade on "weaker" signals than you might otherwise trade on as the stock market is predisposed to move in the direction of BIAS.
- At Risk is generally neutral represented by "-". When it is "Bullish" or "Bearish" it warns of a potential change in the BIAS.
- The Moving Averages are noted as they are important signposts used by the Chartists community in determining the relative health of the markets.
Best ETFs to buy now (current positions):
Long DIA at $161.48 as of December 19, 2013
Long QQQ at $85.99 as of December 19, 2013
Long SPY at $181.19 as of December 19, 2013
Click here to learn more about my services and for our ETF Trend Trading.
Value Portfolio:
Long SDRL at $33.90 on June 15, 2012 (Shares were put to us when options expired. We were paid $1.10 per share when we sold those options and bought shares for $35.00 each.) We have collected dividends: June 10, 2014 $1.00, March 5, 2014 $0.98, December 3, 2013 $0.95, September 5, 2013 $0.91, June 5, 2013 $0.88, $1.70 Dec 4, 2012, $0.84 Sep 4, 2012. Total = $6.28 in dividend payments.
Short FXE at $124.19 on August 24, 2012
Long UUP at $22.43 on August 24, 2012
Short FXE at $134.48 on October 4, 2013
Long SDRL at $35.43 on Feb 18, 2014
Long SDRL at $33.50 on March 21, 2014 (Shares were put to us when options expired. We were paid $1.50 per share when we sold those options and bought the shares for $35.00 each.) We have collected dividends: June 10, 2014 $1.00.
Short GLD at $26.38 on July 3, 2014
We publish new reports to our free newsletter every month. If you're not a member, sign up by clicking here: Free Stock Market Newsletter
Equities gapped up at the open, traded mostly sideways for the first hour then headed higher the rest of the holiday shortened session, with the exception of the final fifteen minutes which was some selling action. Still, it was enough for all the major indexes to record fractional gains with the Dow and S&P-500 closing at new all time highs and the NASDAQ-100 at a multi-year high. All equity indexes we regularly monitor closed above their 20-, 50-, and 200-Day Moving Averages (DMAs). All have a BULLISH BIAS and are in uptrend states. All posted gains. Longer Term Bonds (TLT 110.68 -0.40) posted a fractional loss and shifted to a downtrend state. It closed below its 20- and 50-DMAs and maintains a NEUTRAL BIAS. Trading volume was very light with 402M shares traded on the NYSE and trading volume on the NASDAQ also fell to very light with 986M shares traded due to an early close ahead of the Fourth of July U.S. holiday.
There were ten economic reports of interest released:
• Challenger Job Cuts (Jun) fell -20.2% versus May's +45.5%
• Non-farm Payrolls (Jun) came in at 288K versus an expected 210K
• Non-farm Private Payrolls (Jun) came in at 262K versus an expected 213K
• Unemployment Rate (Jun) came in at 6.1% versus an expected 6.3%
• Hourly Earnings (Jun) rose +0.2% as expected
• Average Workweek (Jun) came in at 34.5 hours as expected
• Initial Jobless Claims for last week came in at 315K as expected
• Continuing Jobless Claims for last week came in at 2.579M versus an expected 2.580M
• Trade Balance (May) came in at -$44.4B versus an expected -$45.2B
• ISM Services (Jun) came in at 56.0 versus an expected 56.5
All but the last report were released an hour or more before the open. ISM Services came out a half hour into the session.
Apple (AAPL 94.03 +0.55) posted a fractional gain. AAPL constitutes about 20 percent of the NASDAQ-100 and nearly five percent of the S&P-500.
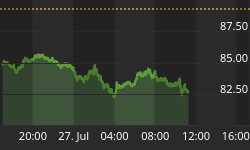
Seadrill Limited (SDRL 40.22 +0.27) posted a fractional gain. The next target above remains $40.96, it's closing price on the last trading day of 2013. It is in an uptrend state. We sold March 2014 $35.00 put contracts for $150 at the open on Feb 18th, 2014 and bought shares at $35.43. The stock is now trading ex-dividend for $0.98 and one dollar for total dividends issued of $1.98. The stock fell back to just below its 200-DMA. The shares were put to us at $35.00 less the $1.50 per share we were paid for the puts, so we have an effective price of $33.50.
The U.S. dollar rose four tenths of one percent while the Euro fell a like amount. The dollar continues to trade below its 200-DMA while the Euro failed to break up through its 200-DMA.
The yield for the 10-year treasuries rose two basis points to close at 2.65. The price of a barrel of crude oil fell forty-two cents to close at $104.06. The U.S. government reported a draw down of -3.155M barrels of crude oil last week.
The implied volatility for the S&P-500 (VIX 10.32 -0.50) fell nearly five percent to a multi-year low. The implied volatility for the NASDAQ-100 (VXN 11.36 -0.23) fell two percent to a new all time low.
Market internals were bullis. Advancers led decliners 4:3 on the NYSE and by 2:1 on the NASDAQ. Up volume led down volume better than 2:1 on both the NYSE and the NASDAQ. The index put/call ratio rose +0.35 to close at 1.39 equity put/call ratio fell -0.08 to close at 0.49.
Conclusion/Commentary
Holiday shortened trading prior to the Fourth of July holiday is always light and this session was no exception. Still, market internals were all bullish as equity indexes mostly hit all time or multi-year highs. This market is still the bulls to lose. Longer term bond prices continued breaking down. Gold miners (GDX 26.50 +0.02) closed flat while we advocated shorting at $26.38. We believe in this trade but will exit the trade on a move higher than $26.90, which would result in a two percent loss on the trade. We will remain long equities until we see signs of a reversal.
We hope you have enjoyed this edition of the McMillan portfolio. You may send comments to mark@stockbarometer.com.


