• 393 days Could Crypto Overtake Traditional Investment?
  • 397 days Americans Still Quitting Jobs At Record Pace
  • 399 days FinTech Startups Tapping VC Money for ‘Immigrant Banking’
  • 402 days Is The Dollar Too Strong?
  • 403 days Big Tech Disappoints Investors on Earnings Calls
  • 404 days Fear And Celebration On Twitter as Musk Takes The Reins
  • 405 days China Is Quietly Trying To Distance Itself From Russia
  • 406 days Tech and Internet Giants’ Earnings In Focus After Netflix’s Stinker
  • 409 days Crypto Investors Won Big In 2021
  • 410 days The ‘Metaverse’ Economy Could be Worth $13 Trillion By 2030
  • 411 days Food Prices Are Skyrocketing As Putin’s War Persists
  • 413 days Pentagon Resignations Illustrate Our ‘Commercial’ Defense Dilemma
  • 413 days US Banks Shrug off Nearly $15 Billion In Russian Write-Offs
  • 416 days Cannabis Stocks in Holding Pattern Despite Positive Momentum
  • 417 days Is Musk A Bastion Of Free Speech Or Will His Absolutist Stance Backfire?
  • 417 days Two ETFs That Could Hedge Against Extreme Market Volatility
  • 419 days Are NFTs About To Take Over Gaming?
  • 420 days Europe’s Economy Is On The Brink As Putin’s War Escalates
  • 423 days What’s Causing Inflation In The United States?
  • 424 days Intel Joins Russian Exodus as Chip Shortage Digs In
Stock Barometer

Stock Barometer

Stock Barometer

Stock Barometer is completely independent. We have never and will not ever accept compensation from any company whose stock we recommend. Our goal is to…

Contact Author

  1. Home
  2. Markets
  3. Other

A Summer To Remember

7/7/2014 6:01:06 AM

Good morning traders,

As we head into our projected peak in the stock market, signals are starting to align. As we always do, here are the charts to make some conclusions with in our trading services.

Let's start with oil:

oil Volatility Chart

With our oil and natural gas service, we're always looking at their relationship to see which one we should be trading:

UNG Relative Strength versus USO Spread Chart

And another concern from oil is the volatility from options activity:

USO Seasonality Chart

We have seasonality charts for all indices we trade.

Switching over to Market Sentiment:

AAII % Neutral Chart

This neutral peak can be bearish, and it hasn't been this high in a while.

Moving towards money flow, it continues to be bullish but we are seeing a hint of a reversal. If it wasn't in line with our key reversal date approaching, it wouldn't be such a big deal.

Cumulative Equity Money Flows Chart

Our QQQ Trader indicator, has reached back towards highs. As we've shown, at these levels 1 month returns are zero to -5%.

QQQ Trader Primary System Chart

Also, looking at new highs on the Nasdaq, we see a potential bearish divergence setting up...

NASDAQ Yearly New Highs Chart

On the below chart of bonds and the SPY, we see their relative action at a similar place as the 2007/8 peak.

SPY versus Bonds Relative Strength Chart

And looking at qqq and bonds, we see that the relationship is holding up to the bullish side. We'll watch for this to break as a sign that things are changing.

QQQ Relative Strength versus Bonds Spread Chart

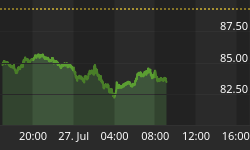
And finally, I'll leave you with a chart of gold oipcr.

GLD Options Open Interest Put/Call Ratio Chart

I see this reaching an end soon, and we'll be looking for a trade in gold/options soon.

Regards,


Back to homepage

Leave a comment

Leave a comment